

Price-volume effect: analyzing the evolution of your brand's turnover in supermarkets
Learn how to use the price effect and volume effect to understand the sales growth of your brand in mass retail.

In short
6 min read
The analysis of sales revenue in retail is based on three key indicators: the price effect, the volume effect, and the cross effect.
Brands regularly adjust their product strategy and pricing policy to adapt to fluctuating consumer trends and competition.
The cross effect is an essential tool for measuring the net impact of a promotion, by combining the opposing effects of a price decrease and a volume increase.
A positive cross effect reveals strategic opportunities, allowing for the optimization of marketing campaigns, shelf visibility, and pricing.
Integrating these indicators into sales forecasting helps to anticipate performance related to price adjustments, product assortment, or seasonality.
The rigorous use of data collected by the commercial CRM is fundamental to refining strategic decisions and maximizing margins.
Interpreting the evolution of its sales revenue in mass retail can be a complex task for your brand. Indeed, general consumption trends and the information shared with you by your distributors do not always allow you to understand why sales increased, decreased, or stagnated. Even worse: you cannot always make the connection between the evolution of your product strategy, your pricing strategy, and their impact on revenue.
You will therefore discover how the price effect and the volume effect can help you better understand the evolution of your sales revenue.
Let's go!
Evolution of your brand's sales revenue in mass retail
To increase their sales revenue in mass retail or protect their margins during inflationary periods, brands have a certain number of marketing tools at their disposal. Prior to promotion and merchandising, strategy always focuses on assortment, i.e., defining a set of products that maximizes revenue by addressing each market segment with a product/price mix.
However, you are not the only ones working on your positioning and your marketing mix: your competitors are doing it too! Added to this are often fluctuating consumption trends. For all these reasons, you are regularly led to change your strategy, either by evolving your product range or by adjusting your pricing (and often both at the same time).
Result: these changes impact your sales.
But to what extent exactly? Was it volume or price that contributed the most to the evolution of sales revenue?
To answer this question, we will review 3 indicators:
The price effect;
The volume effect;
The cross effect.
And for those who skipped math class at school, don't panic! We are going to back up this demonstration with a concrete example, so that everything is clear.
Example of calculating the price-volume effect on a brand's sales revenue in mass retail
This year, your famous yogurt brand achieved a surprising growth in its sales revenue in one retail outlet in particular. The scientific sales director that you are cannot stop there: you want to identify the real causes of this evolution. Especially since it will surely help you work on your strategy in the region's other sales outlets!
Here are the figures you observe between 2022 and 2023.
2022 | 2023 | Change | |
|---|---|---|---|
Selling price | 10 € | 12 € | 2 € |
Volume sold | 8200 | 8350 | 150 |
Sales revenue | 82000 € | 100200 € | 18200 € |
Price effect: definition and calculation formula
The price effect refers to the impact of the pricing changes of a product or service on the final sales revenue it generated.
Here is its calculation formula (for an annual frequency):
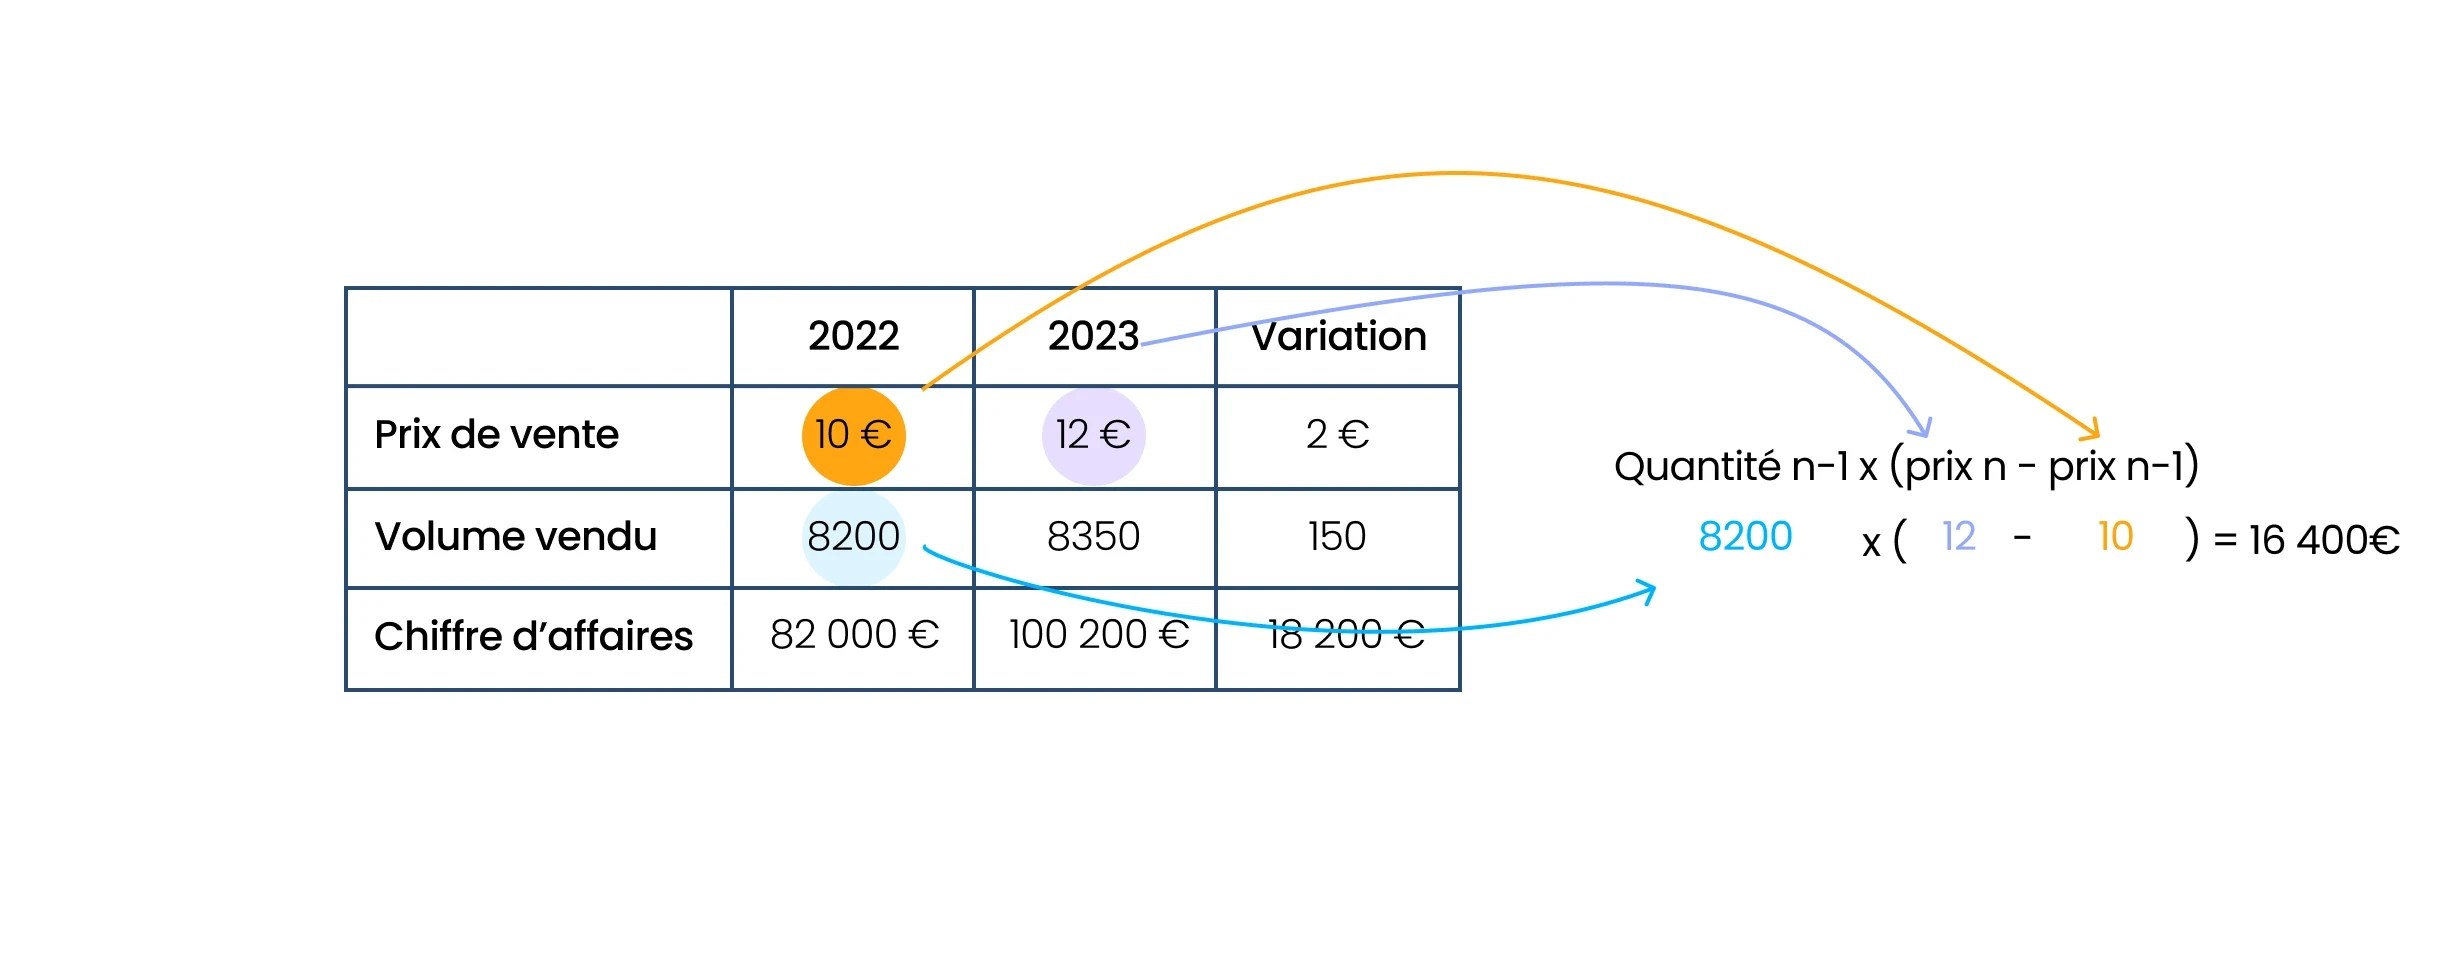
Price effect = volume N-1 x (price N - price N-1).
The indicator reflects a change relative to the volume of the previous year. In this way, it is possible to correlate the change in price with the evolution of sales revenue, and understand to what extent it impacted it.
The result is positive if your products were sold at a higher price than the previous year.
📕 In our example:
Price effect = 8200 x (12 - 10) = 16400 €.
Volume effect: definition and calculation formula
The volume effect represents the impact of change in the quantity of products or services sold on the resulting final sales revenue.
Here is its calculation formula (annual frequency):
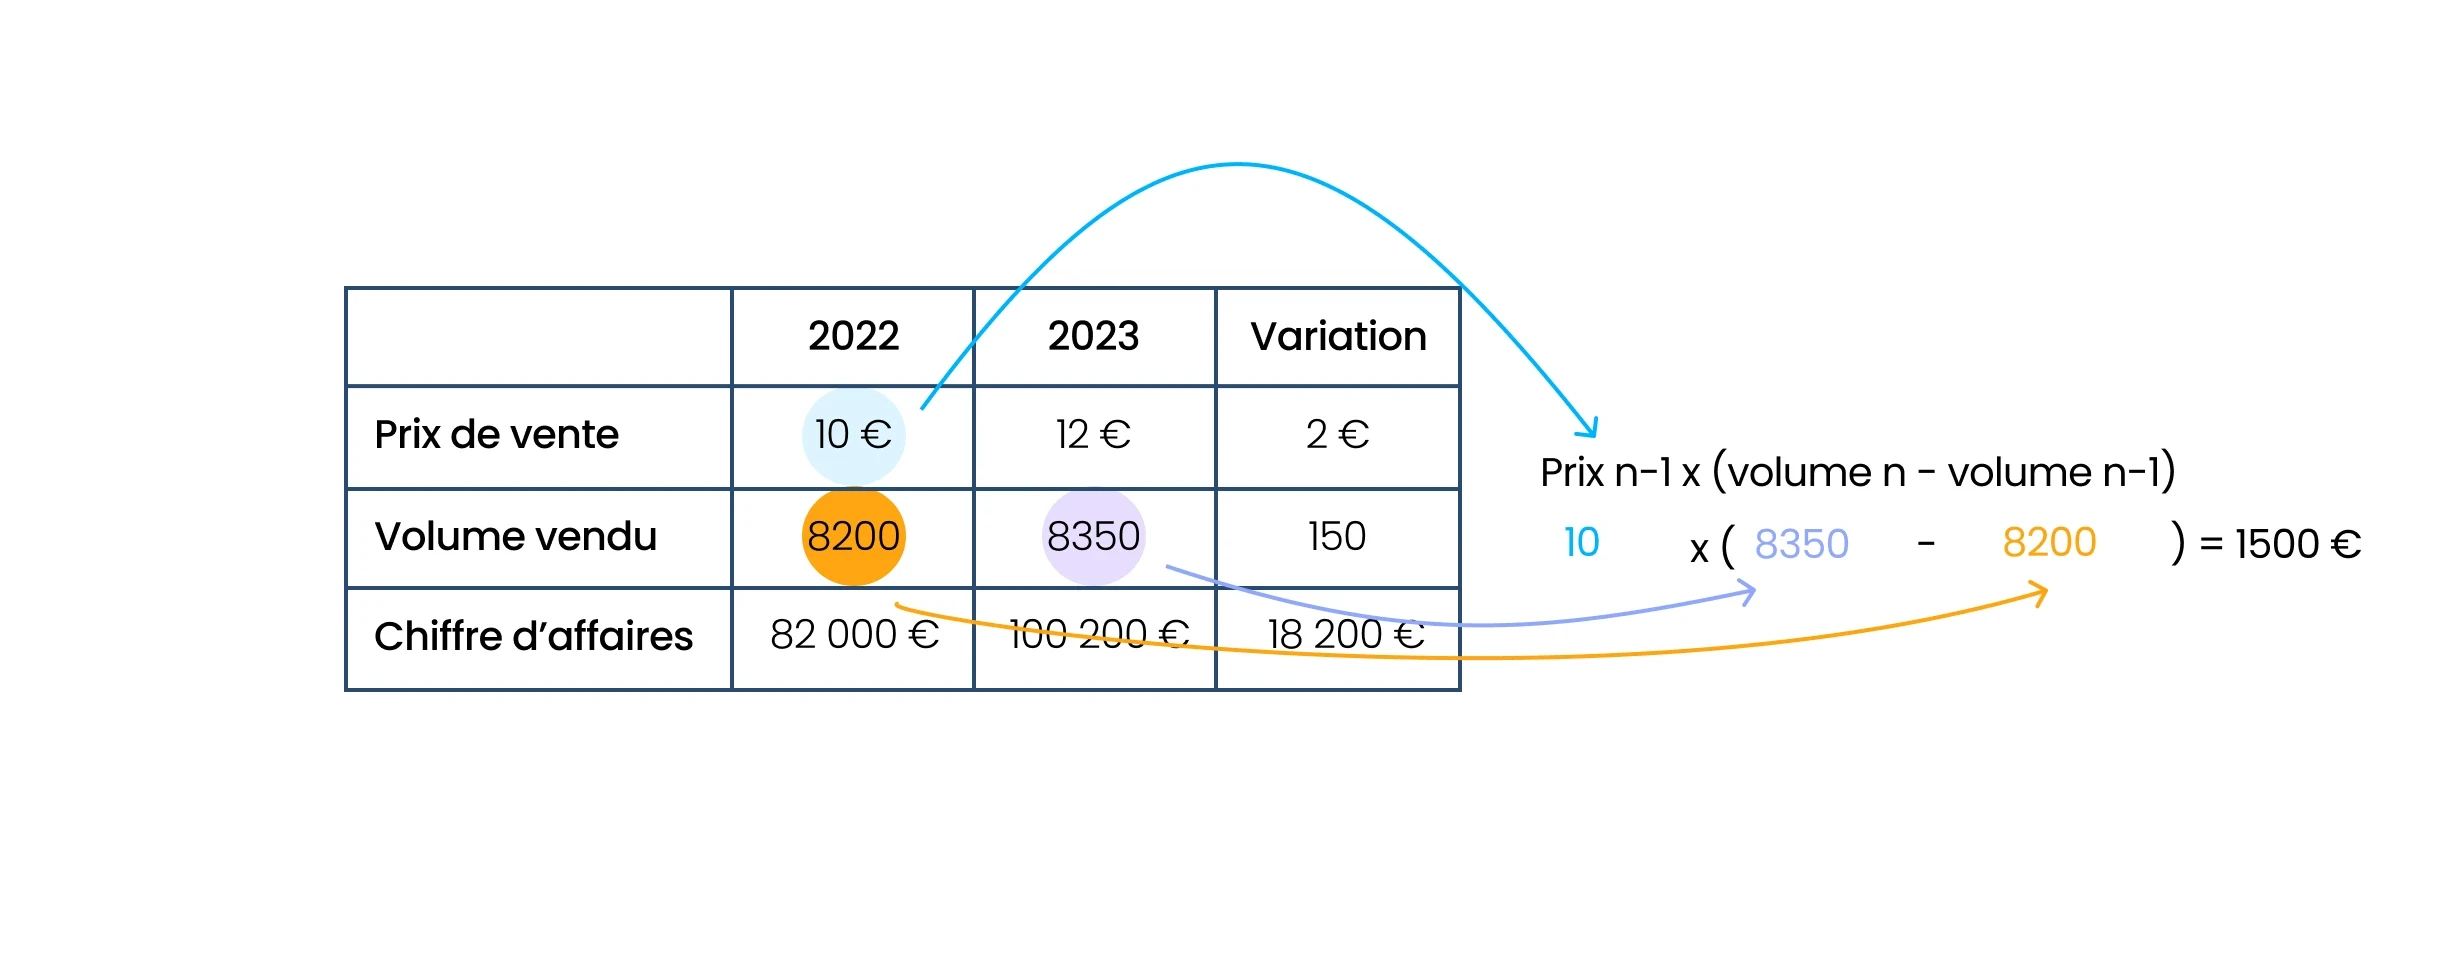
Volume effect = price N-1 x (volume N - volume N-1).
As before, we start with the price of the previous year. The objective is to measure the contribution of its evolution to that of sales revenue.
The result is positive when the quantities of products sold have increased.
📕 In our example:
Volume effect = 10 x (8350 - 8200) = 1500 €.
Cross effect (price-volume): going further in the analysis
In practice, it is common for price and volume changes to interact. When your prices decrease, volumes tend to rise, and the opposite is also true. However, it can also happen that prices and quantities increase or decrease simultaneously, with or without correlation.
This is why there is generally a residual rate that can be attributed to both price and volume. That is the cross effect!
Here is the calculation formula (still for annual frequency):
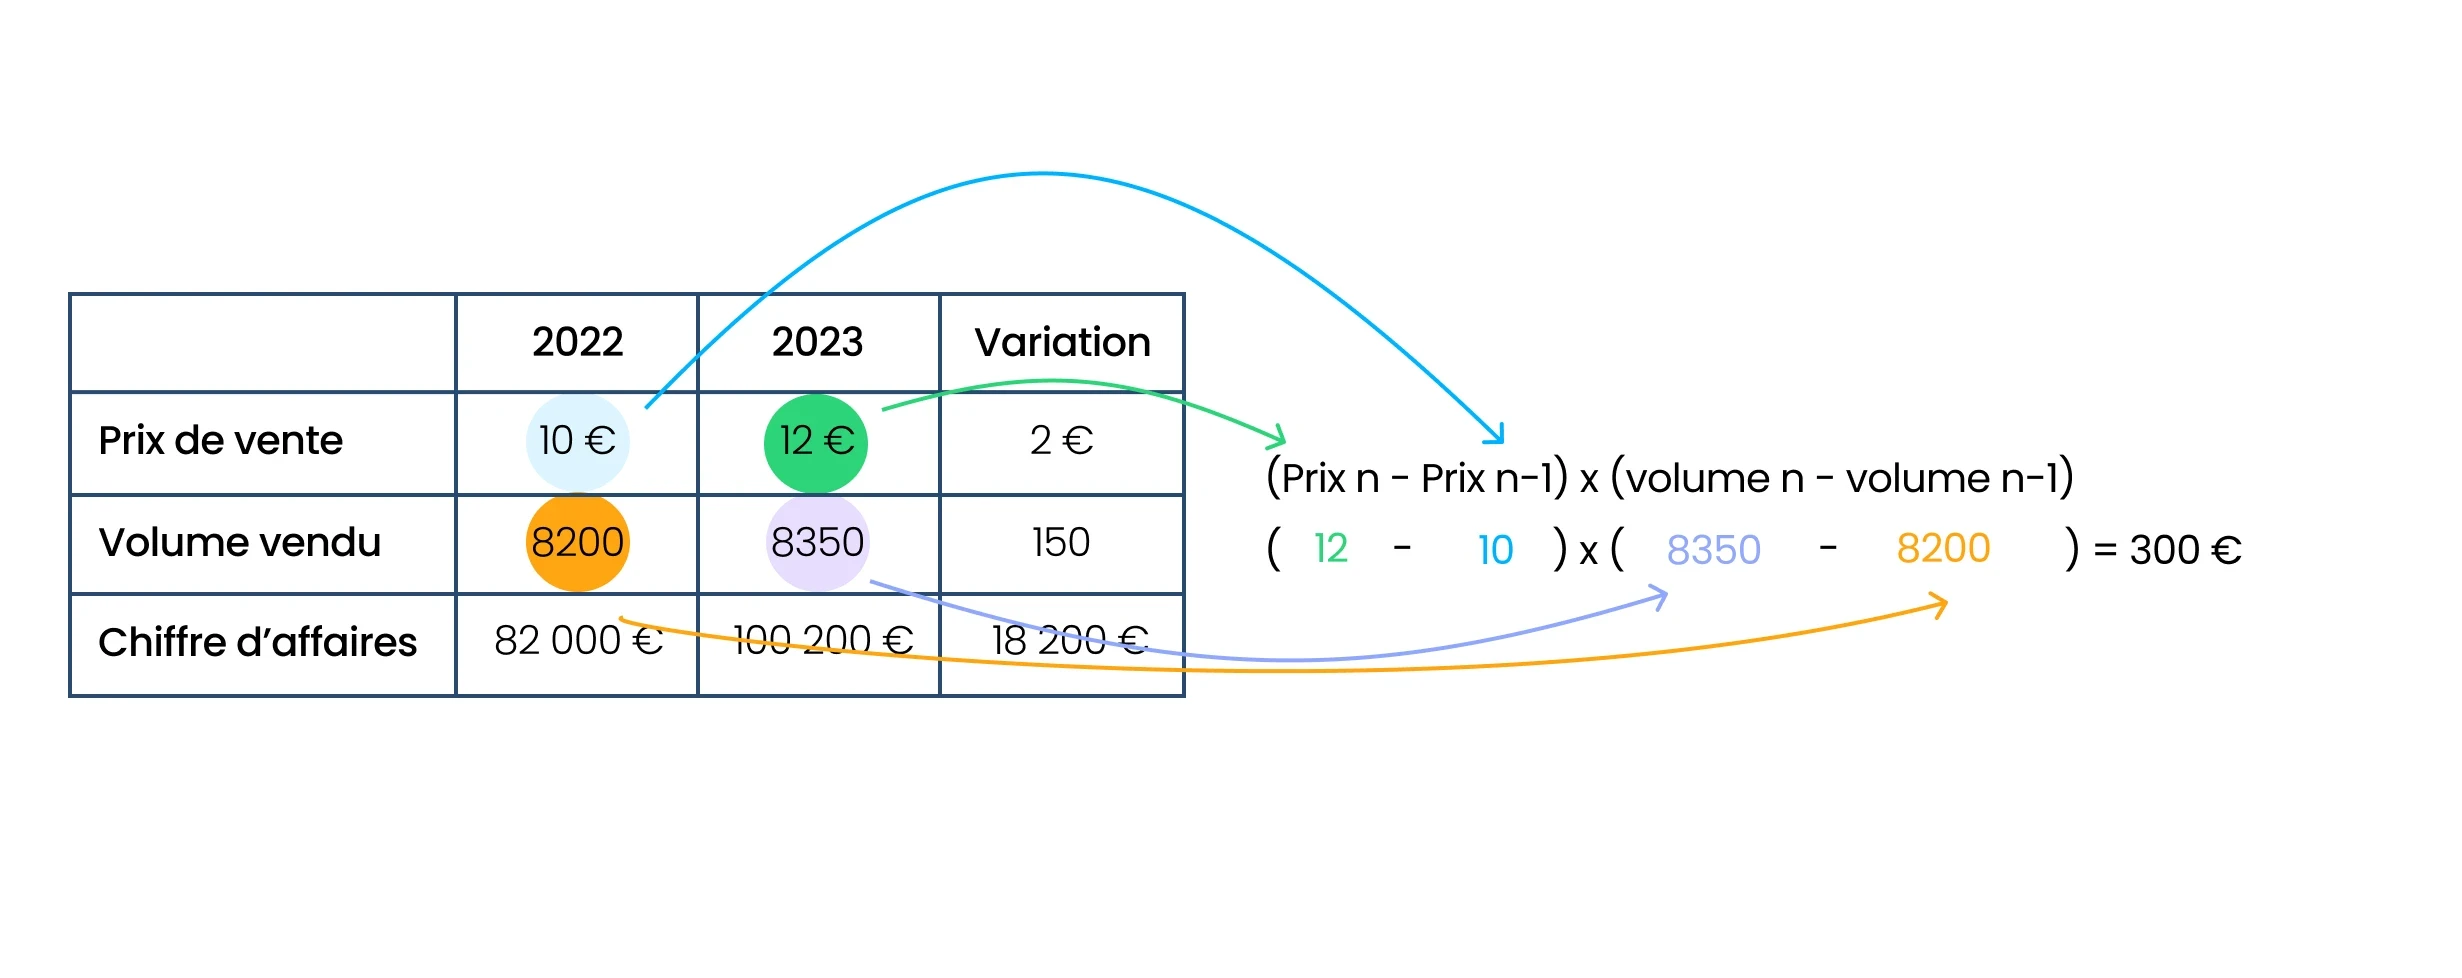
Cross effect = (price N - price N-1) x (volume N - volume N-1).
📕 In our example:
Cross effect = (12 - 10) x (8350 - 8200) = 300 €.
Analysis of the price - volume effect
In our example, we immediately see that the price effect is much more significant than the volume effect.
Price effect = 8200 x (12 - 10) = 16400 € ;
Volume effect = 10 x (8350 - 8200) = 1500 € ;
Cross effect = (12 - 10) x (8350 - 8200) = 300 €.
This means that the change in price had much more of an impact on sales revenue than the change in the number of products sold.
The cross effect, for its part, represents the residual impact that can be attributed as much to price as to volume.
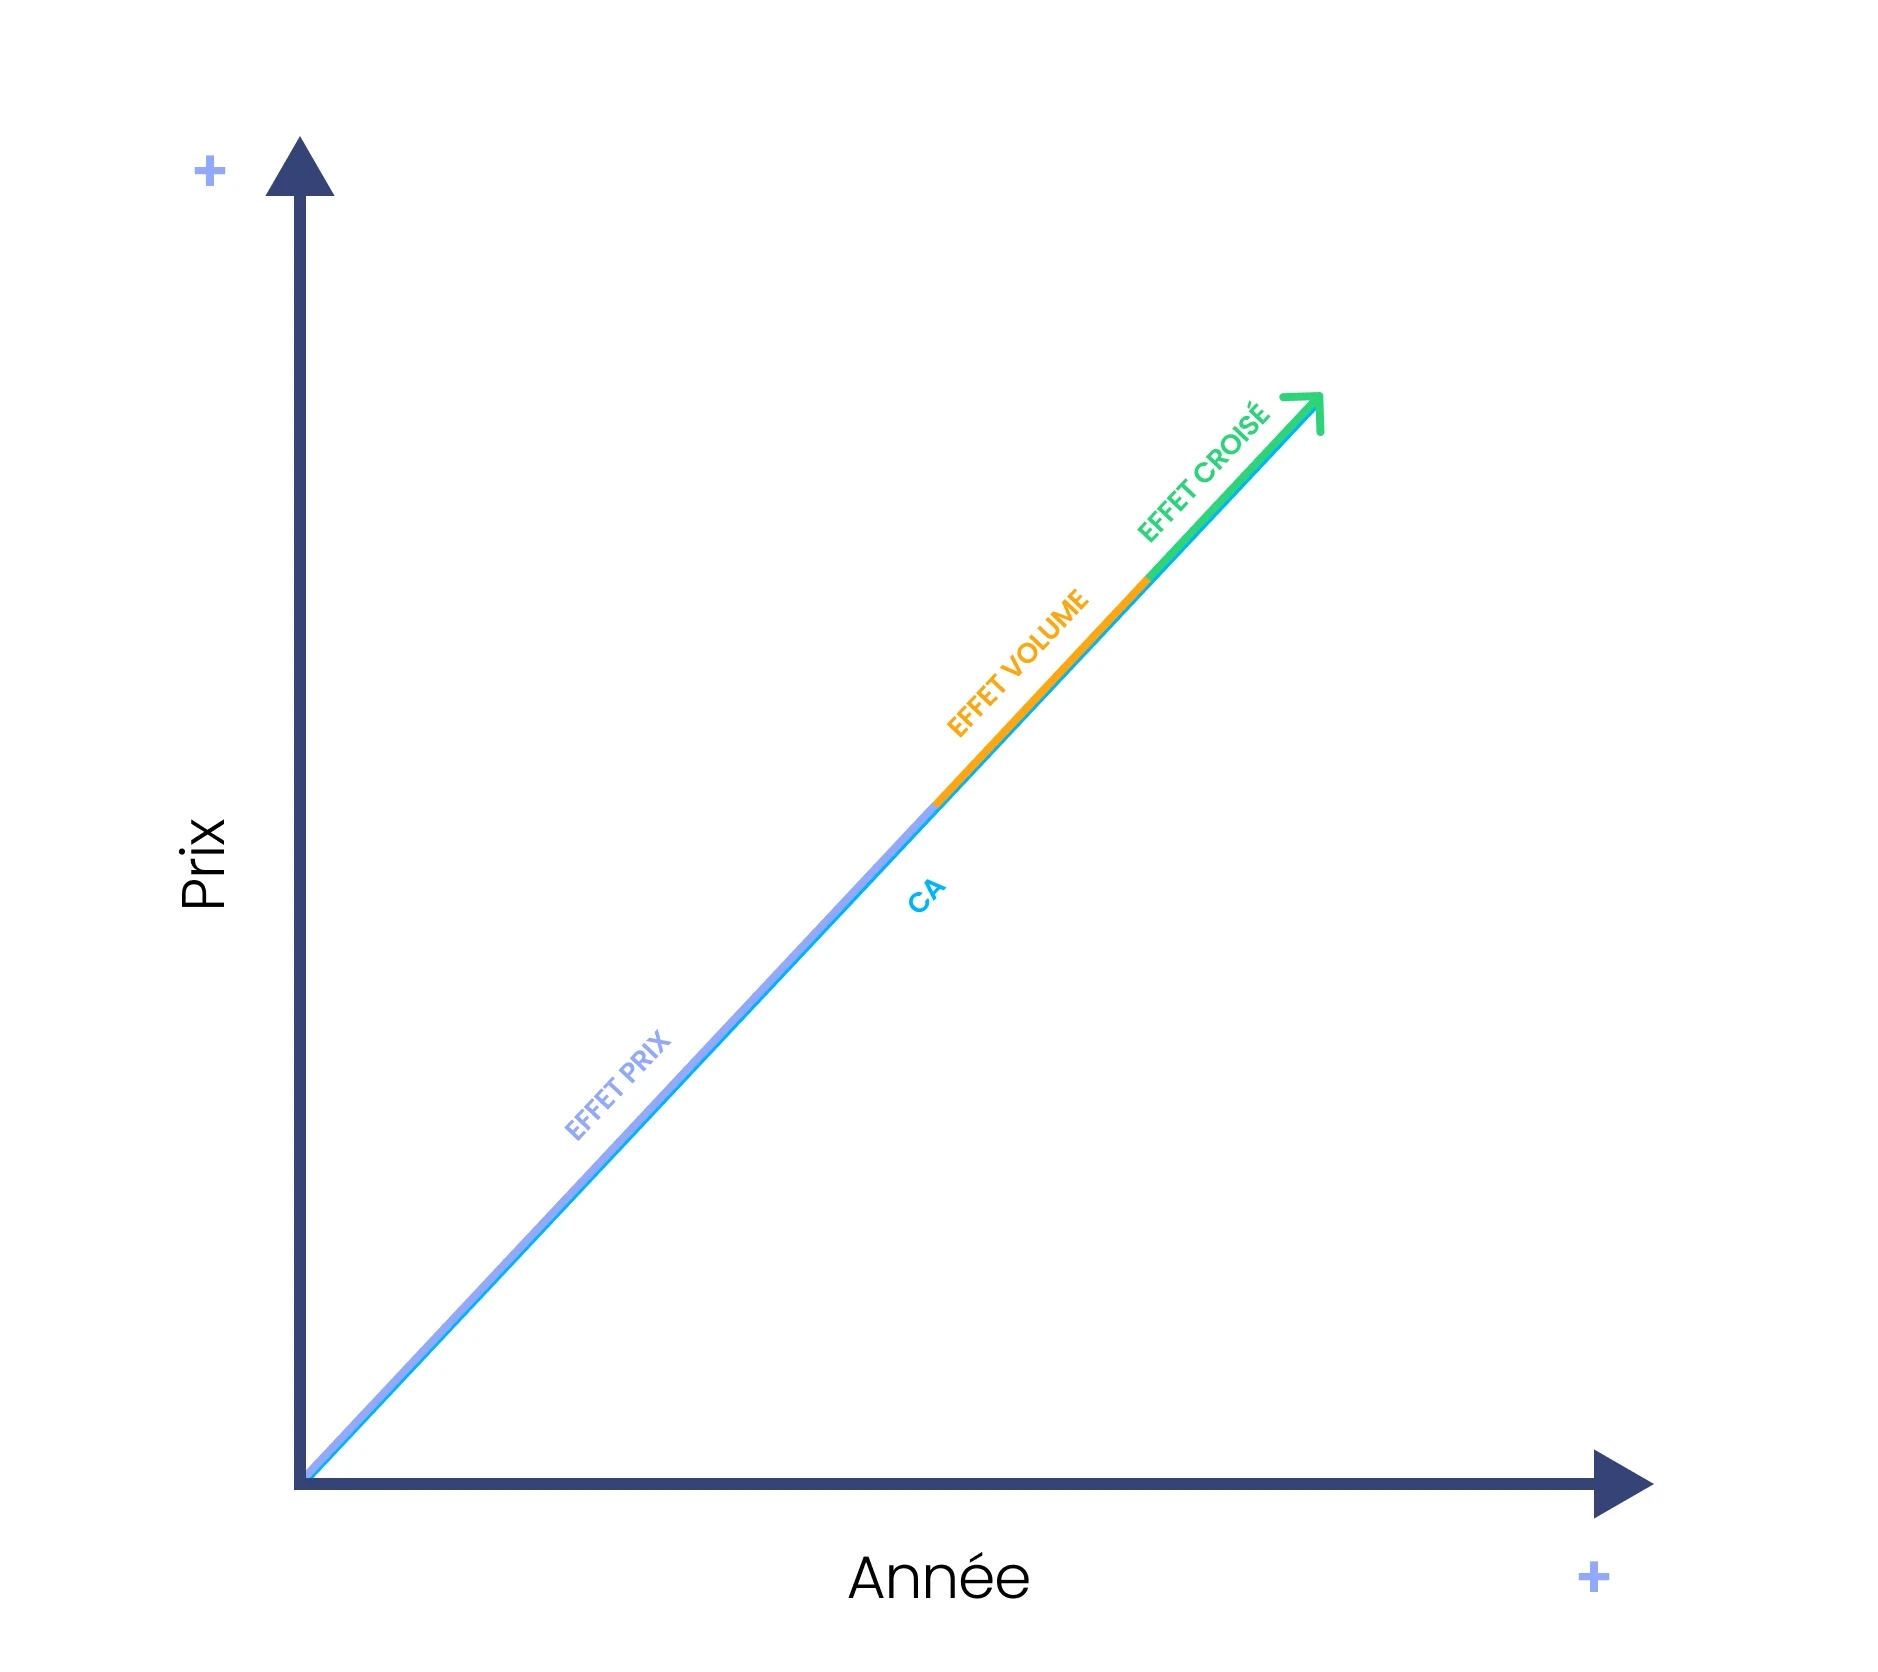
A little observation for calculation fans: if you add up the 3 indicators, you get... the evolution of sales revenue!
Sales revenue change = price effect + volume effect + cross effect = 18200 €.
How to use the price-volume effect concretely?
While these calculations are mostly used by general management, many stakeholders within the company can use them to understand changes in their respective sales areas: commercial directors, national sales directors, regional sales directors, or even sector managers!
Develop sales and add references
Just like panelist data and mass retail store mapping, the price-volume effect can be a powerful lever for your sector managers when negotiating new commercial conditions. This can include adding a reference under test, increasing the number of facings, or integrating a product into a new category. Price and volume effects are used to identify and evaluate the different elements that impact a company's sales revenue, but it is entirely possible to scale them down to a single product, a retail outlet, or even a retail chain.
Let's take the example of a kombucha brand, mainly present on ambient shelves. Its sales director notices a positive price effect on its sales in its Intermarché Express and U Express outlets on the Côte d'Azur during the summer season. This means that the price increase contributed to a rise in sales revenue generated by these outlets. In this context, it could be strategic, as summer approaches, to send their sector managers to negotiate directly with shelf managers or store managers to obtain more shelf space, add references to the fresh section, and increase facings in the ambient aisle.
It is important to remember that your sector managers, during their visits, cannot always discuss prices. Highlighting these effects is a good way to negotiate with the shelf manager without actually talking about prices. The salesperson can, for example, highlight the volume effect to lower the prices implemented by the distributor. This is even more important during inflationary periods.
And as always in mass retail, base yourself on real figures. For example, if you have access to checkout data from a retailer, you will be able to get reliable and, above all, very useful results!
Optimize your promotions
It is difficult to discuss pricing strategies around price-volume effects without addressing the issue of promotions, which are one of the most powerful tools to influence these effects. Properly managed, they allow for increased volumes, but watch out for their impacts on overall sales revenue.
⚠️ Limiting the windfall effect
A classic trap of promotions is simply satisfying your regular shoppers at a lower cost, without attracting new consumers. To maximize their effectiveness, your promotions must target expanding your customer base or strategic inventory clearance, such as seasonal clearance or product launches.
Let's take the example of our kombucha brand which, as summer comes to an end, decides to use a promotion to clear its remaining stock. The sector managers negotiate temporary price reductions with the stores to boost sales. Here is the result:
Without promotion | With promotion | Change | |
|---|---|---|---|
Selling price | 2.5 € | 2 € | -20 % |
Volume sold | 3000 | 3200 | 200 |
Sales revenue | 7500 € | 6400 € | -900 € |
At first glance, revenue decreased due to a negative price effect (caused by the reduction in unit price).
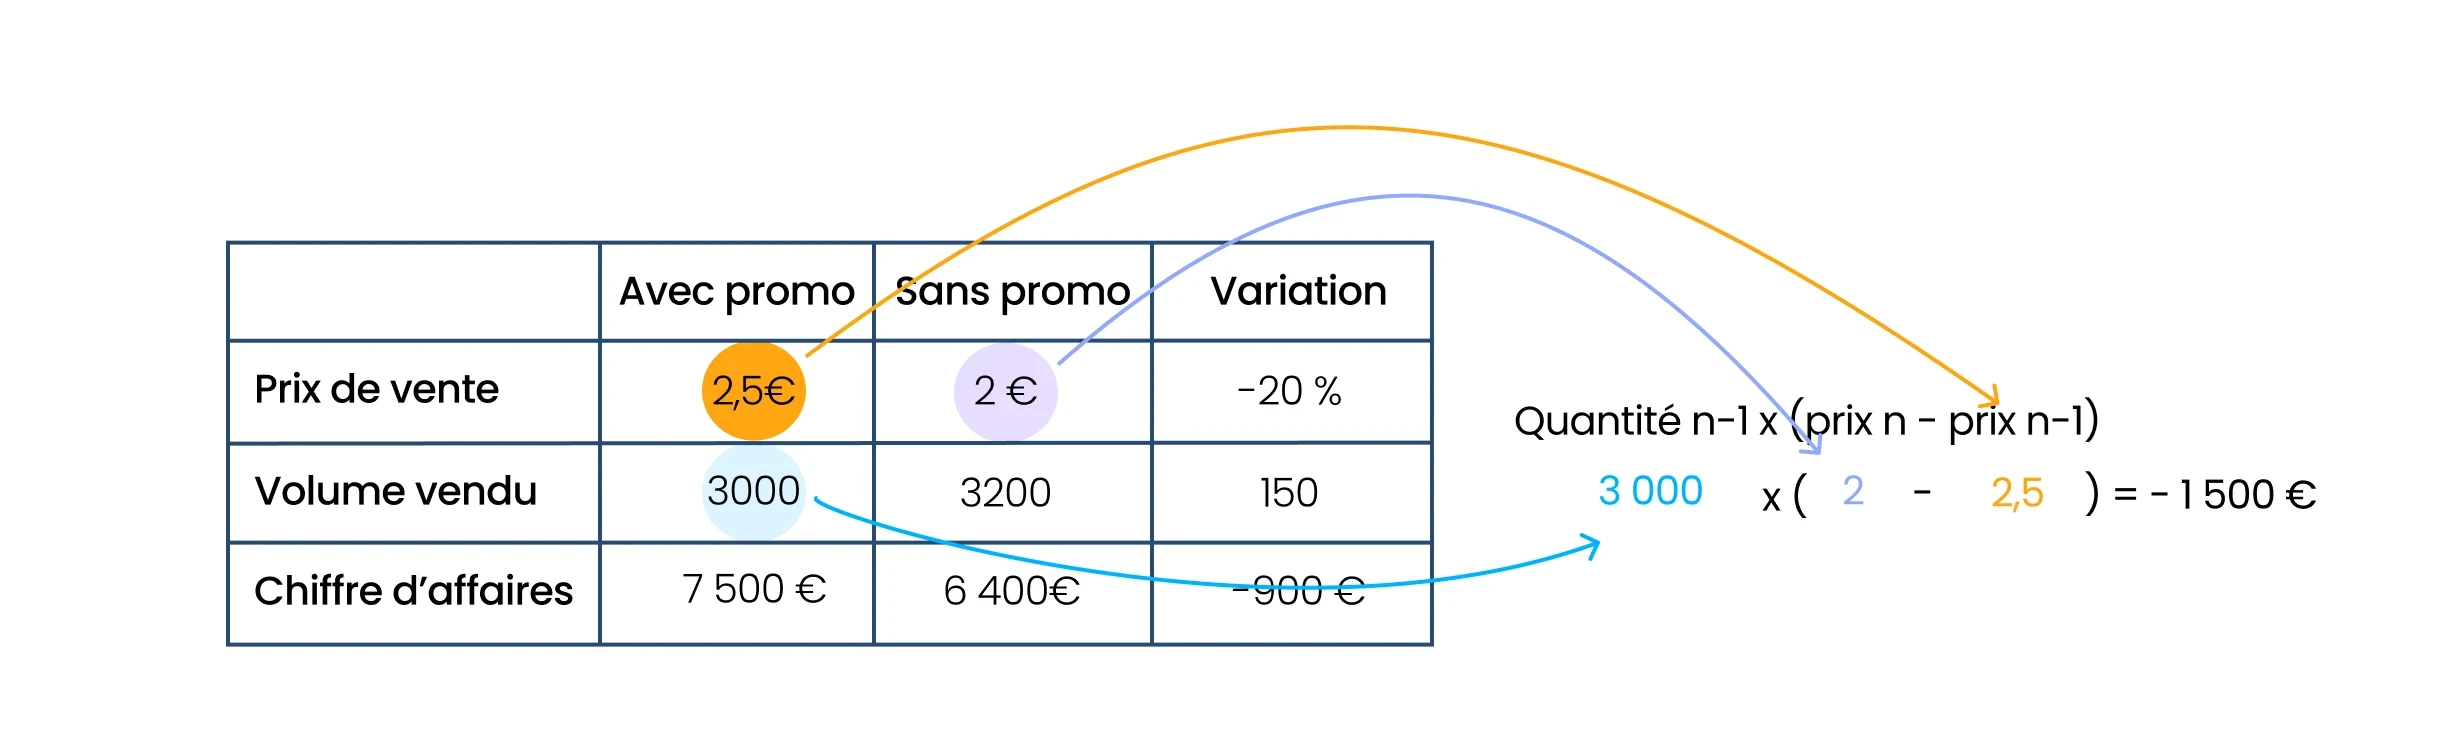
However, a more detailed analysis shows a positive volume effect thanks to the increase in the number of products sold.
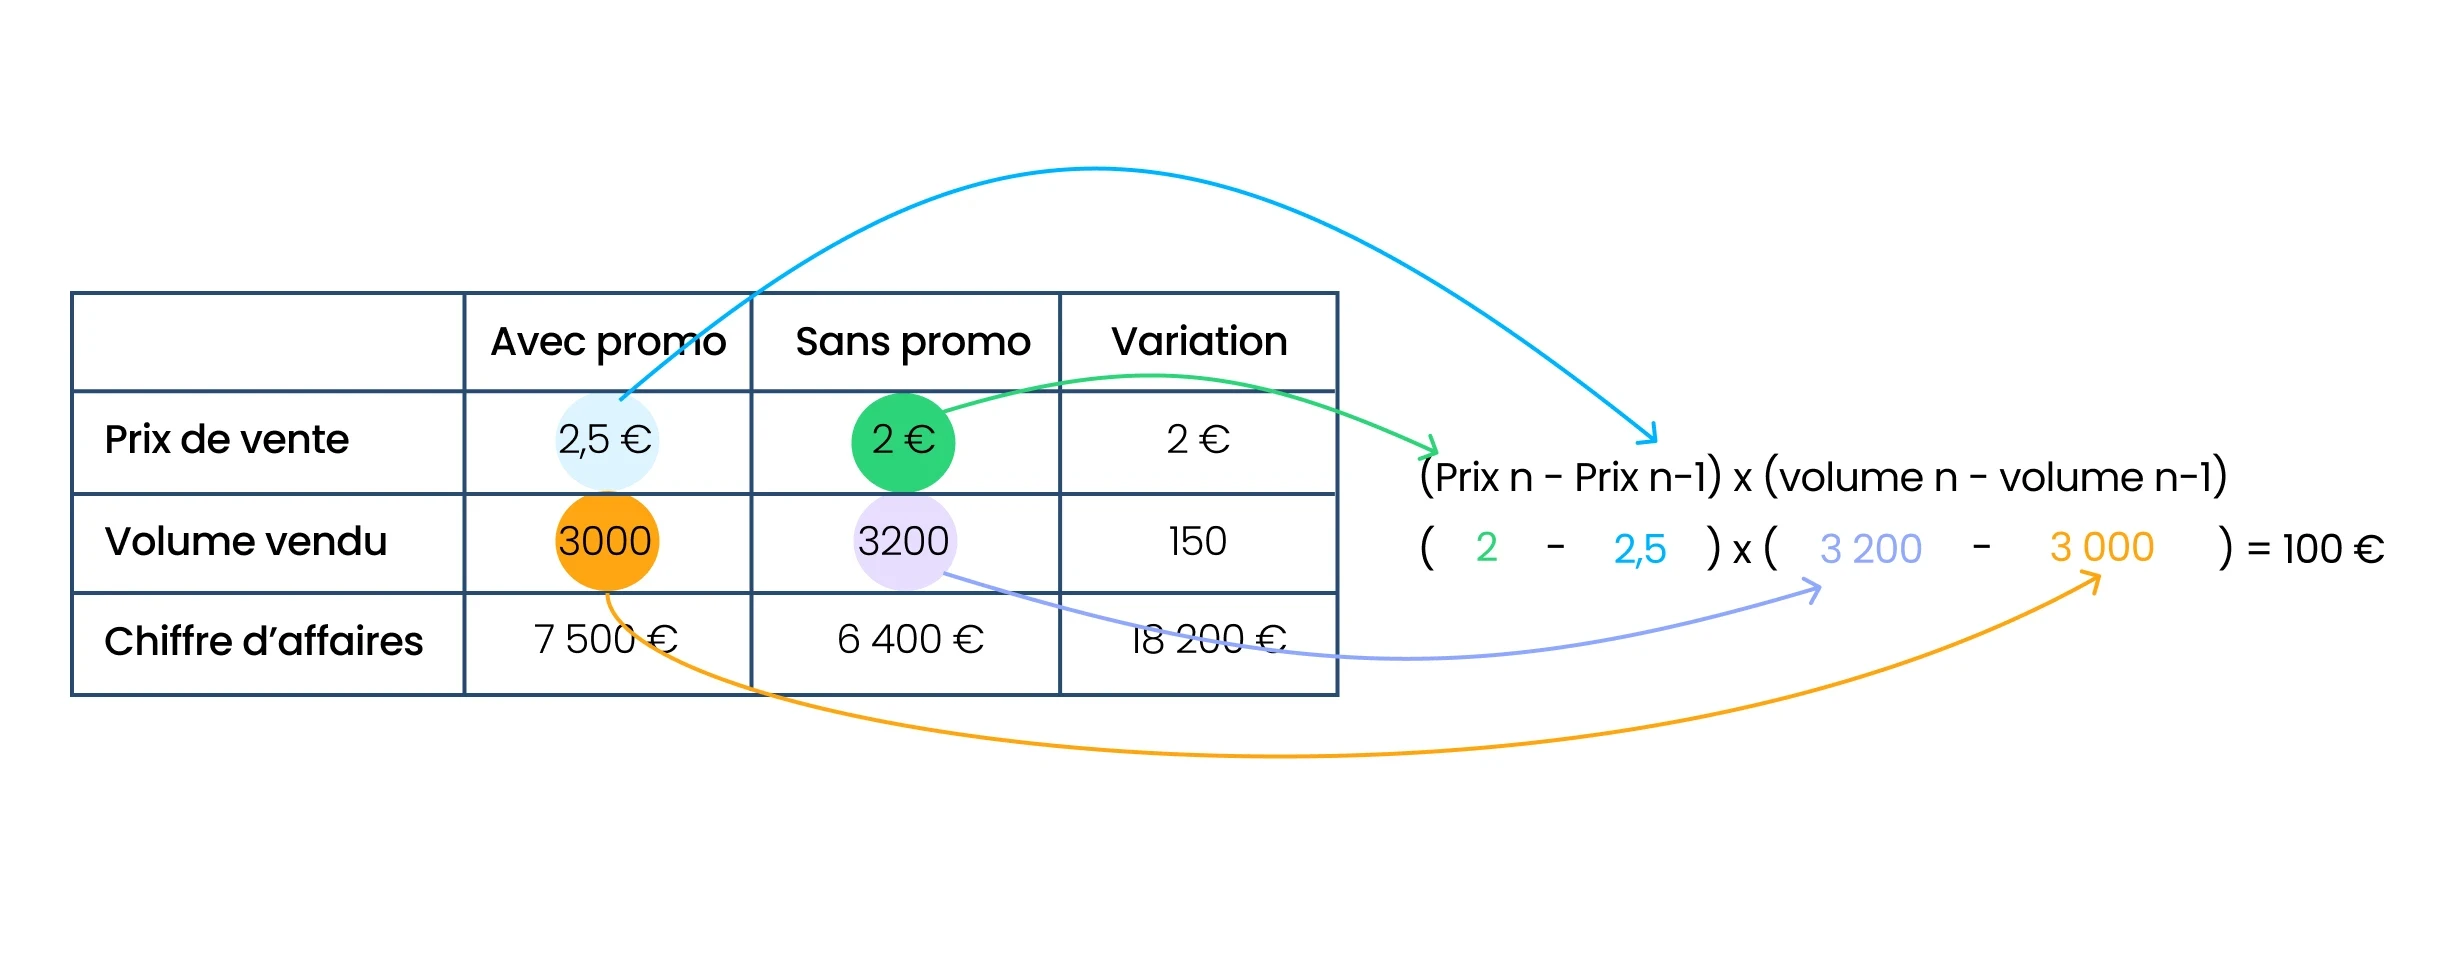
The importance of the cross effect
To better understand the overall impact of this promotion, it is necessary to calculate the price-volume cross effect, which takes into account both the drop in price and the rise in volumes:
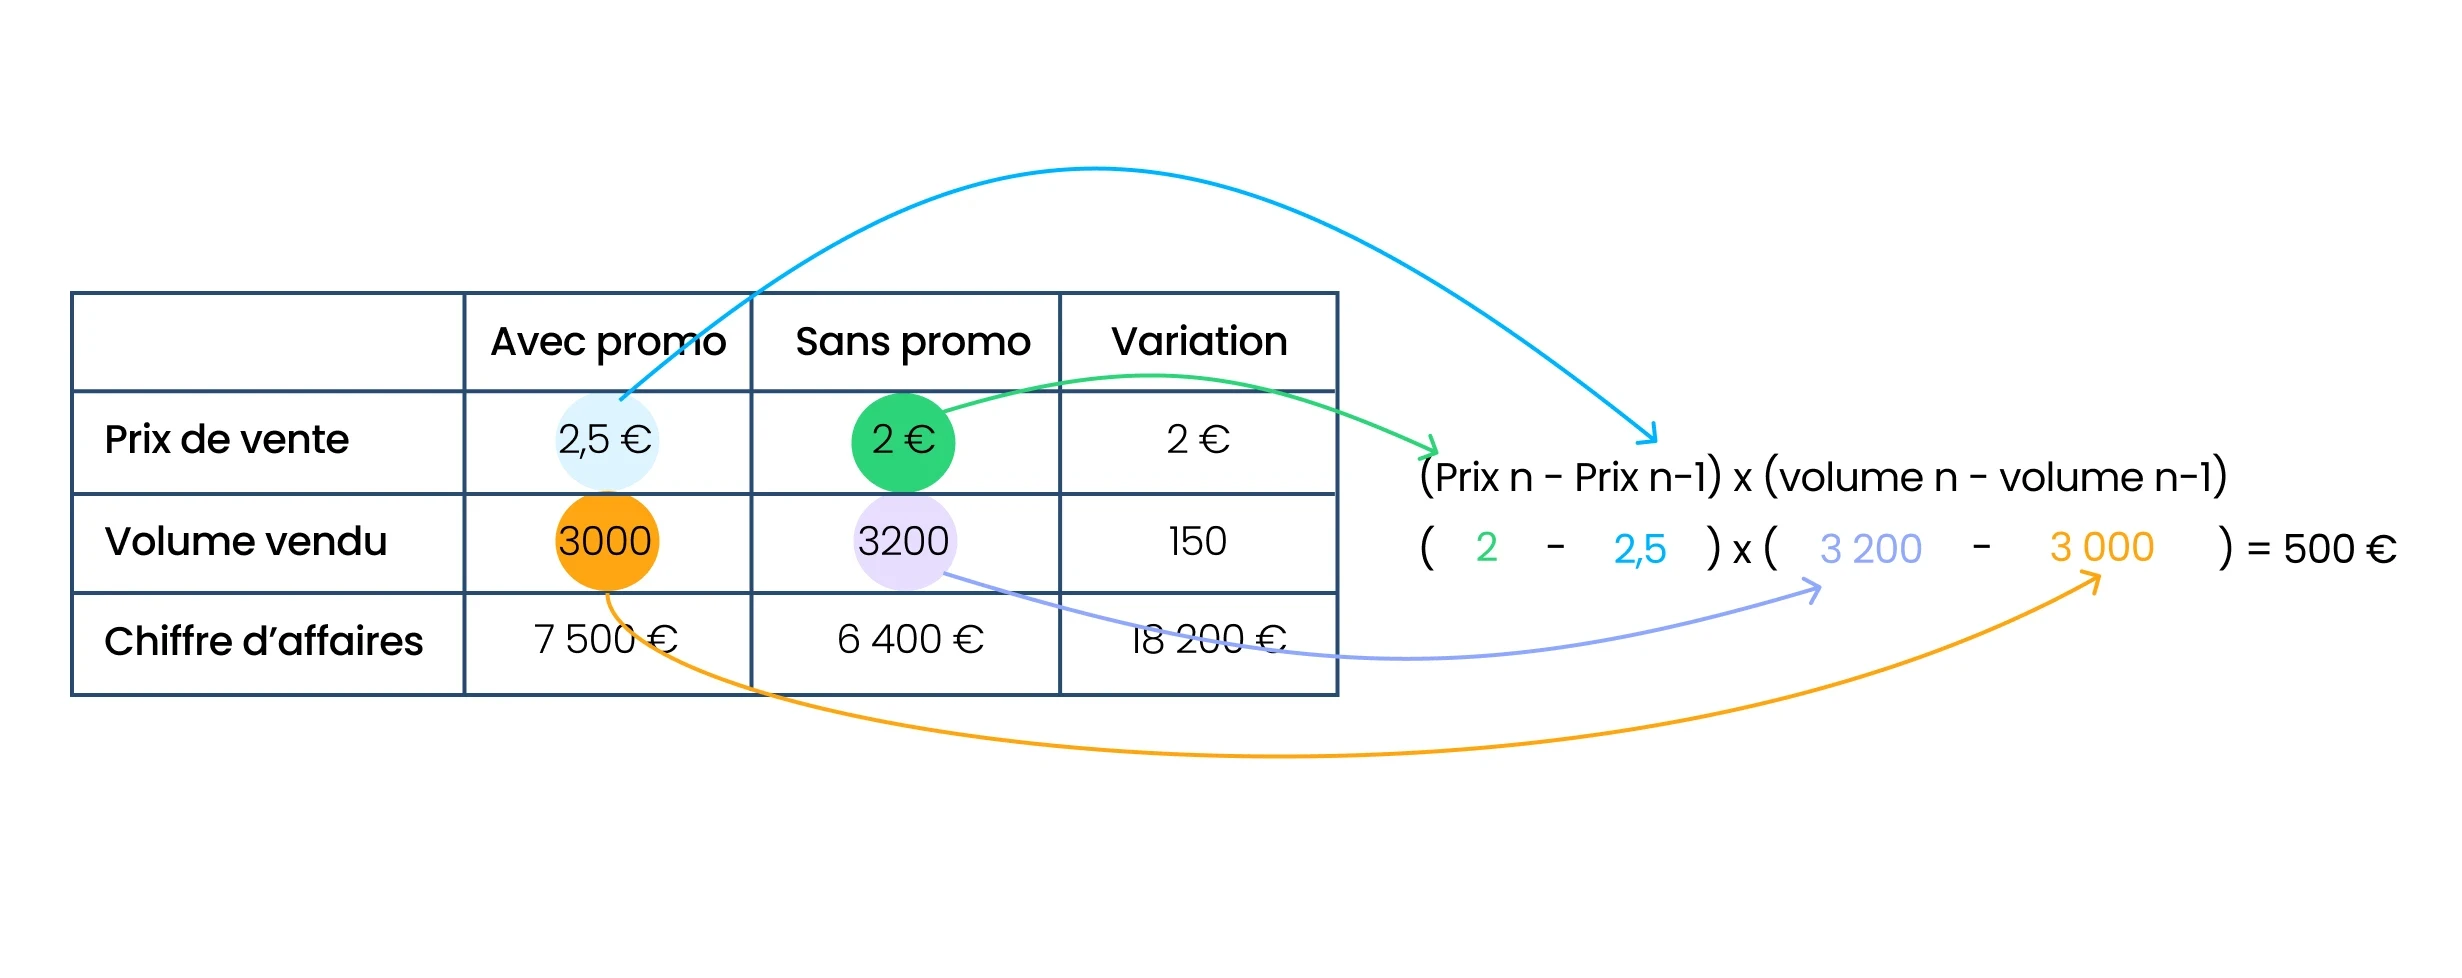
The calculation shows here that the cross effect is positive, with a gain of 100€. This means that, despite a decrease in revenue due to price, the increase in volumes sold generated a favorable overall impact. This type of analysis is crucial to evaluate the success of a promotion.
Leveraging positive cross effects
A positive cross effect often reveals strategic opportunities that brands can exploit. In this example, it could be wise to:
Adjust future marketing campaigns to include similar promotions at key moments (for example, at the end of each season).
Negotiate more shelf visibility by highlighting the promotion's capacity to generate high-volume sales.
Refine pricing based on the feedback obtained to maximize margins while stimulating volumes.
Integrate the price-volume effect into your forecasts
A positive cross effect describes a situation where a change in one variable (such as the price or volume of a product) generates a favorable impact on another variable or on overall results, such as revenue. In other words, interactions between different factors (price, volume, product mix, or geographical areas) contribute to an overall improvement in sales performance.
In this case, it is wise to integrate these effects into your commercial strategy and sales forecasts:
Positive price-volume effect: an increase in a product's price did not lead to a significant drop in volume sales. On the contrary, consumers continue to buy in similar or even higher quantities, resulting in an increase in overall revenue.
→ Action: keeping this price increase in your forecasts allows you to anticipate revenue growth for the coming year.Assortment-Profitability effect: adding a new reference on shelves stimulated sales of other products in the range. For example, introducing a new kombucha flavor can attract more consumers, thereby increasing sales of existing references.
→ Action: negotiate with your partners to establish this new reference permanently on shelves and plan for an increase in volume sales for the coming months or year.Area-Seasonality effect: a product sold in a specific region during a seasonal period performs better thanks to targeted actions (local communication, favorable weather, etc.). This success can justify strengthening presence in this area during other times of the year or across other product categories.
→ Action: consider strengthening your sales force during this key period, for example by using field sales forces to maximize opportunities during this critical period.
Once again, it is very important to rely on the data stored in your commercial CRM. Leverage data from past sales to identify future trends and refine your decisions.
Success! You now know how to handle the price effect, the volume effect, and the cross effect, three indicators that will allow you to better understand the evolution of your sales revenue. In the world of mass retail, which is subject to permanent changes, mastering these indicators gives you a higher level of analysis. You can then make the best strategic decisions.
Are you looking for commercial performance? Discover our dedicated retail sales solutions!
For the past five years, Corentin has supported more than 200 sales teams, making him one of the longest-serving members of the company. He has seen the product evolve alongside the industries he supports, giving him a deep understanding of actual use cases. Between onboarding calls and training sessions, he has built up rare, hands-on expertise: knowing exactly what saves teams time.
See also

Artificial intelligence and field professions: what our 2026 studies reveal
Adoption, barriers, use cases: discover what our three studies reveal about the role of AI among sector managers, sales representatives, and foodservice sales reps.

CHR and RHF Sales Representatives: portrait of a relationship-driven profession in the era of data
Equipment, productivity, AI: discover the major trends for the HORECA and food service sales profession in 2026 through our field study.

Pharmaceutical Sales Representative in France: Portrait of a Field Job Under Pressure
Compensation, aspirations, AI usage: discover the major trends in the pharmaceutical sales representative profession in 2026 through our field study.

Area Sales Managers in France: who are they and how is the profession evolving in 2026?
Compensation, aspirations, AI usage: discover the major trends in the field sales representative profession in 2026 through our field study.
The area manager professions in 2026
Discover the trends, the challenges, and the key figures.