

How to calculate revenue and analyze it effectively?
Formula, turnover by product, per period, per salesperson: how to calculate and analyze your revenue with concrete, numerical examples.

In short
4 min read
Definition and formula for calculating revenue
Methodologies for segmenting revenue by product or service
Temporal analysis of revenue to identify seasonal trends
Evaluation of sales performance by individual or team
Use of numerical examples to facilitate the interpretation of financial data
Ah, revenue.
Often reduced to a bookkeeping metric, it is actually a real strategic lever. And you already know that.
Revenue (or sales turnover) provides an immediate reading of business activity: it reveals how much you are selling and in which categories, showing which lines are driving growth and which are declining.
Revenue does not measure profitability on its own but it is the starting point: the more it grows on a constant-scope basis, the more fixed costs are absorbed. Conversely, stagnation or a drop can quickly create a scissors effect.
But to use it effectively, you still need to know how to calculate it, how to read it… which is exactly what we explain in the article below.
A manufacturer's revenue is based on its sell-in sales, meaning what it invoices to its distributors. But to manage business activity properly, you also need to monitor sell-out, which measures what the distributor actually sells to the final consumer. It is important to understand the difference between revenue and sell-in.
Revenue: a few reminders
Revenue is a fundamental financial indicator: it corresponds to the total amount of sales of goods or services made by a company over a given period, expressed excluding tax.
Revenue is the total sales excluding tax, and serves as the baseline to analyze commercial performance before studying profitability (via margin and net income).
Revenue does not take costs into account (raw materials, wages, logistics).
It is an indicator of business volume, not profitability. For that, you should look instead at net income, which subtracts costs from your revenue.
Revenue can be measured:
by product or line,
by point of sale,
by distribution channel,
or globally for the company.
How to calculate revenue?
Revenue is calculated by multiplying the quantity sold by the unit selling price excluding tax.
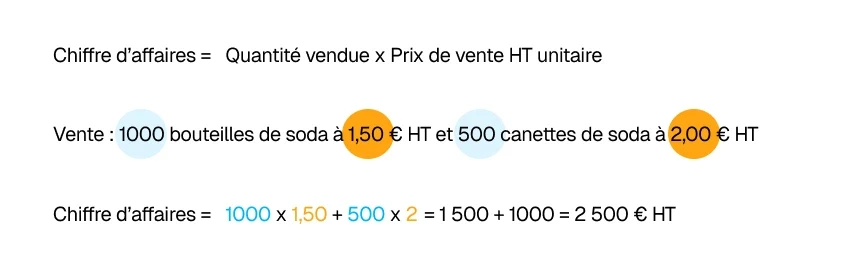
For example, if you sell:
1,000 bottles of soda at €1.50 excl. tax → €1,500
500 cans of soda at €2.00 excl. tax → €1,000
Your total revenue = €2,500 excl. tax
How to calculate the evolution of revenue?
The evolution of revenue makes it possible to measure the growth (or decline) of a company's or brand's activity between two periods.
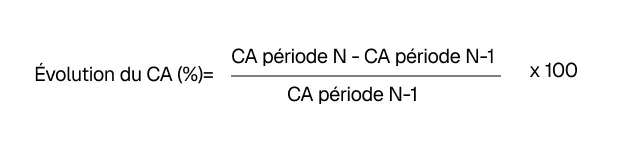
The evolution of revenue compares two periods (e.g., year N vs. N-1). It is calculated as a percentage or in absolute value and is used to analyze the dynamics of the activity.
You can measure the percentage change in revenue with this formula:
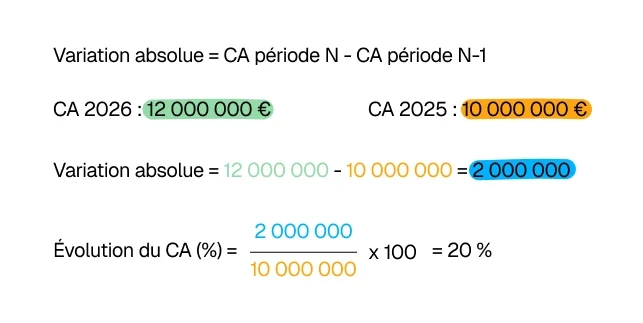
You can measure the change in revenue in absolute value with this formula:
The comparison must be made on a constant-scope basis (excluding new acquisitions, site closures, etc.), otherwise the raw change can be misleading.
You can measure the evolution of revenue overall (all channels or categories combined) but also by segment (product category, region, store tier, type of establishment, etc.) or by channel (supermarkets, hotels/restaurants/cafés, out-of-home catering, e-commerce, etc.).
Let's take a simple example. In 2026, you generated 12 million euros in revenue compared to 10 million in 2025. You have therefore achieved a growth of 20% = ((12 - 10) / 10) x 100.
How to calculate percentage revenue contribution?
The percentage revenue contribution shows what share a category, product, brand, or client represents in the total revenue.
It is a simple tool to visualize the share of each segment and guide decisions (assortment, promotion, negotiation).
To calculate it, you need to know the total revenue of your brand and that of the segment you want to analyze.
Here is the formula:

Let's take an example.
Your company has an annual revenue of €1,000,000:
Line A = €400,000
Line B = €350,000
Line C = €250,000
👉 Calculation:
Contribution of Line A = (400,000 ÷ 1,000,000) × 100 = 40%
Contribution of Line B = (350,000 ÷ 1,000,000) × 100 = 35%
Contribution of Line C = (250,000 ÷ 1,000,000) × 100 = 25%
How to calculate revenue per point of sale?
Measuring the global revenue of a network is good. Knowing which point of sale is performing and which one is falling behind allows you to take action.
Here is the formula: POS Revenue = Sum of sales made at this point of sale over the period (excl. tax)
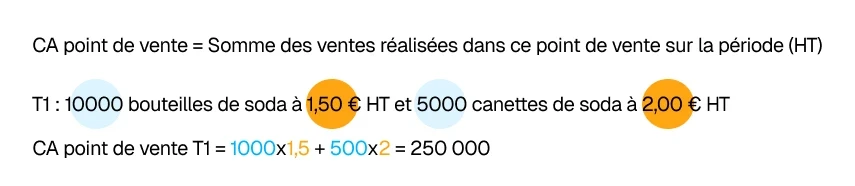
Example of calculating revenue in supermarkets, by point of sale
A food brand tracks its 3 Leclerc hypermarkets in an area:
Store | Revenue Q1 2026 | Revenue Q1 2025 | Evolution |
|---|---|---|---|
Leclerc Bordeaux Nord | €18,400 | €21,000 | −12.4% |
Leclerc Bordeaux Sud | €24,100 | €22,800 | +5.7% |
Leclerc Mérignac | €19,700 | €19,500 | +1.0% |
Bordeaux Nord is falling behind significantly. The area manager can then target this point of sale as a priority: check shelf presence, numeric distribution (DN), facing status, and negotiate a local activation.
This tracking works the same way in DIY consumer stores (home improvement, gardening), where each banner (Leroy Merlin, Castorama, Mr. Bricolage) is tracked individually.
Example of calculating revenue in the hotel/restaurant/café sector, by establishment
A beverage distributor tracks its establishments by type:
Establishment | Monthly Revenue | Replenishment Frequency |
|---|---|---|
Brasserie Le Central | €1,200 | 2×/week |
Hôtel Mercure Lyon | €890 | 1×/week |
Restaurant Le Comptoir | €430 | 1×/month |
The restaurant at €430 with a monthly order is at risk of being delisted. The low replenishment frequency points to slow inventory turnover, which needs to be investigated during the next visit.
How to calculate average revenue per client?
This indicator allows you to segment your portfolio and focus sales efforts where they are most profitable.
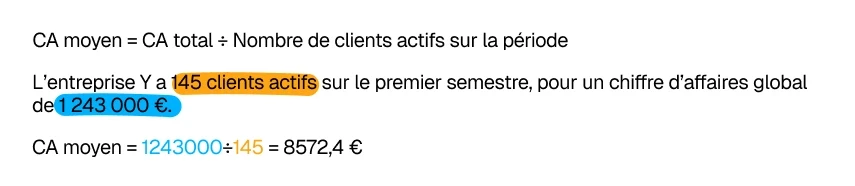
Here is the formula: Average revenue per client = Total revenue ÷ Number of active clients over the period:
Example of calculating average revenue, per client, in supermarket and DIY networks
A brand generates €480,000 in revenue across 160 active points of sale:
Average revenue = 480,000 ÷ 160 = €3,000 per point of sale
Points of sale below €1,500 deserve analysis: low numeric distribution (DN), poor shelf placement, lack of promotional events? Those above €5,000 should be preserved and developed as a priority.
Example of calculating average revenue, per client, in out-of-home catering
A dairy products manufacturer works with 80 contract catering establishments (school cafeterias, care homes, hospitals). Total revenue: €320,000.
Average revenue = 320,000 ÷ 80 = €4,000 per establishment
A care home at €800 annually generates 5 times less than average, either because the listed assortment is too narrow, or because order frequency is insufficient. This is a growth lever that should be activated.
How to calculate forecasted revenue?
Forecasted revenue allows you to anticipate future activity based on historical data and planned commercial campaigns.
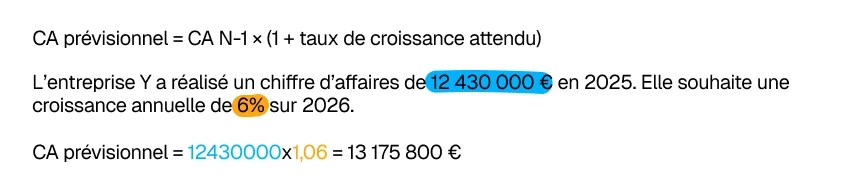
Here is the basic formula: Forecasted Revenue = Revenue N-1 × (1 + expected growth rate)
Here is the refined formula with weighting: Forecasted revenue = (Number of points of sale × Target numeric distribution) × Average basket × Purchase frequency
Example of calculating forecasted revenue in supermarkets
A snacking brand wants to forecast its 2027 revenue across its supermarket network:
2026 Revenue: €1,200,000
Growth objective: +8% (gaining DN in 30 new points of sale + a national promotion campaign)
2027 Forecasted revenue = 1,200,000 × 1.08 = €1,296,000
Example of calculating forecasted revenue in the hotel/restaurant/café sector
A wine supplier works with 200 restaurants. He plans to open 40 new ones in 2027 and expects an average basket of €800 per establishment per year.
Contribution from new clients = 40 × 800 = €32,000
Forecasted revenue = Current revenue + €32,000
How to calculate revenue on a constant-scope basis?
When a network evolves (openings, closures, listings, delistings), the raw variation in revenue can be misleading. Calculating on a constant-scope basis isolates real organic growth.
Here is the formula: Constant-scope evolution = ((Revenue N in points of sale common to both N and N-1) − Revenue N-1 in those same points) ÷ Revenue N-1 × 100
A brand's revenue is up +15% in 2026 vs. 2025. But it opened 25 new points of sale during the year. By adjusting to look only at the 135 stores present in both years, the real growth is +3%. The rest is extensive growth, not intensive.
This distinction is particularly important in supermarkets, DIY, and the hotel/café/restaurant sector to evaluate real on-the-ground performance—independent of prospecting efforts.
Summary table: revenue calculation formulas
Formula | Calculation | Usage |
|---|---|---|
Baseline Revenue | Quantity × Unit Price excl. tax | Calculate the revenue of a product or a line |
Evolution in % | ((Revenue N − Revenue N-1) ÷ Revenue N-1) × 100 | Measure growth over a period |
Evolution in value | Revenue N − Revenue N-1 | Measure the absolute gap between two periods |
Contribution in % | (Segment Revenue ÷ Total Revenue) × 100 | Identify the weight of a product or channel |
Revenue per point of sale | Sum of sales excl. tax at the POS | Compare and prioritize your network |
Average revenue per client | Total Revenue ÷ Number of active clients | Segment your portfolio |
Forecasted revenue | Revenue N-1 × (1 + growth rate) | Anticipate and set goals |
Constant-scope revenue | Evolution in points of sale common to N and N-1 | Isolate real organic growth |
Questions & Answers on revenue
What is the difference between revenue and gross margin?
What is the difference between sell-in revenue and sell-out revenue?
How do you calculate a reliable forecasted revenue?
How do you analyze the evolution of your revenue in supermarkets?
Alexis co-founded Sidely after several years of service as a sales director. To understand what builds, or breaks, a salesperson's performance, he conducted more than 100 telephone interviews with field sales representatives. At Sidely, he transforms this raw knowledge into concrete support, based on facts rather than assumptions.
See also

Artificial intelligence and field professions: what our 2026 studies reveal
Adoption, barriers, use cases: discover what our three studies reveal about the role of AI among sector managers, sales representatives, and foodservice sales reps.

CHR and RHF Sales Representatives: portrait of a relationship-driven profession in the era of data
Equipment, productivity, AI: discover the major trends for the HORECA and food service sales profession in 2026 through our field study.

Pharmaceutical Sales Representative in France: Portrait of a Field Job Under Pressure
Compensation, aspirations, AI usage: discover the major trends in the pharmaceutical sales representative profession in 2026 through our field study.

Area Sales Managers in France: who are they and how is the profession evolving in 2026?
Compensation, aspirations, AI usage: discover the major trends in the field sales representative profession in 2026 through our field study.
The area manager professions in 2026
Discover the trends, the challenges, and the key figures.