

Digital distribution in supermarkets: calculation, analysis, and challenges
Often confused with other indicators, numerical distribution allows your brand to increase its product presence in major retail stores.

In short
6 min read
Digital share of shelf (D.t.N.) measures the ratio between the number of products present on the shelf and the number of products planned in the mandatory assortment.
It is essential to distinguish the digital share of shelf (presence of products on the shelf) from the numeric distribution (number of active stores).
The formula is based on the number of references present divided by the theoretical assortment, and can exceed 100% thanks to the 'picking' of unplanned products.
The calculation requires mastery of store stratifications by sector managers to avoid errors related to a mismatched assortment.
A D.t.N. below 100% is a warning sign that requires dialogue with the department manager to identify bottlenecks (out-of-stock items, competition, shelf placement).
Constant monitoring of this indicator makes it possible to evaluate the implementation of commercial agreements and to correct discrepancies in presence at the point of sale.
Digital distribution in large-scale retail is a fundamental sales indicator. Based on the comparison between the number of references present in the store and that specified in the mandatory assortment, digital distribution contributes to the analysis of your sales performance in supermarkets and hypermarkets. Digital distribution can exceed 100%, since it also takes picking into account.
Today, we address this major topic for any manufacturer wishing to improve their sales results in supermarkets, hypermarkets, and specialized stores.
Digital distribution: definition
Digital distribution (D.t.N.) is the ratio between the number of products present on the shelves of a supermarket and the number of products that should be there, in accordance with the mandatory assortment, provided for in the terms of the distribution agreement.
This major indicator of large-scale retail allows brands to measure the presence rate of their products at the point of sale. It is the most important indicator to track in food retail. If your products are not available on the shelf, they cannot be sold to consumers. And if they are not sold, you will not generate revenue.
Digital distribution can be analyzed by product, but also by product category, by product group (20/80, bestseller, innovation…), by brand, by store, by banner, by stratum, and by sales representative.
Department managers also use this term to express the ratio between the number of references on the shelf and those appearing on the ordering schedule—that is, in the case of integrated distribution, the number of references placed in the catalog by purchasing centers.
DN ≠ DN!
It is important to understand the difference between digital distribution ("détention numérique") and numeric distribution ("distribution numérique"), which are very often confused. When a brand talks about presence rate, it may refer to one or the other. However, they do not calculate the same thing.
Digital distribution calculates the ratio between the number of products present and the number of products that must be present. Simply put, it lets you know if your products are actually present in a store.
Numeric distribution measures the number of active stores for a specific retail brand. Simply put, it lets you know if your points of sale are actually activated. To work on these indicators (the famous DN & DV), read our article on numeric and weighted distribution.
The confusion is so widespread that even Google displays incorrect definitions in its search results. If you are lost, trust us—we are experts in the field!
How to calculate your product digital distribution
The formula for determining digital distribution is very simple: just compare the number of references present on the shelves of a point of sale with the number specified in the agreements, which can be found at the stratum level.
The challenge in calculating your digital distribution is the denominator. This denominator is none other than the assortment. But the assortment can vary depending on the stratum. There is therefore a risk in its calculation: if the field sales rep, during their store visit, performs their audit on the wrong assortment, your DN will be incorrect.
As a reminder, strata represent the number of references a store offers per product and per shelf.
Digital distribution = number of references on shelf / number of references planned in the mandatory assortment.
It is generally expressed as a percentage.
If you find that your retailer's shelf offers 3 references while the contract calls for 4, your digital distribution is 75%. It also happens that a distributor offers additional references outside of the mandatory assortment. This is called 'picking.' This occurs projectively when your brand is highly successful in that store. Thus, when 5 references are present on the shelf versus 4 mandatory in theory, your digital distribution for this point of sale is… 125%!
Number of mandatory products present | Number of additional products present | Number of products in the mandatory assortment | Digital distribution | Picking digital distribution | Cumulative digital distribution |
|---|---|---|---|---|---|
4 | 2 | 5 | 80% | 40% | 120% |
5 | 0 | 6 | 83% | 0% | 83% |
2 | 3 | 7 | 28.5% | 42.8% | 71.3% |
So much for the calculation method.
But you still need to have the data… In reality, digital distribution is one of the indicators that brands determine from presence audits carried out by field rep managers.
It is therefore essential that your field reps master this major performance indicator, but also that they have a robust method for collecting strategic information from your partner points of sale.
💡 Feel like your sales reps could improve their information gathering at points of sale?
-> Take the time to raise their awareness about the 8 benefits of a good shelf audit.
The challenges of digital distribution in large-scale retail
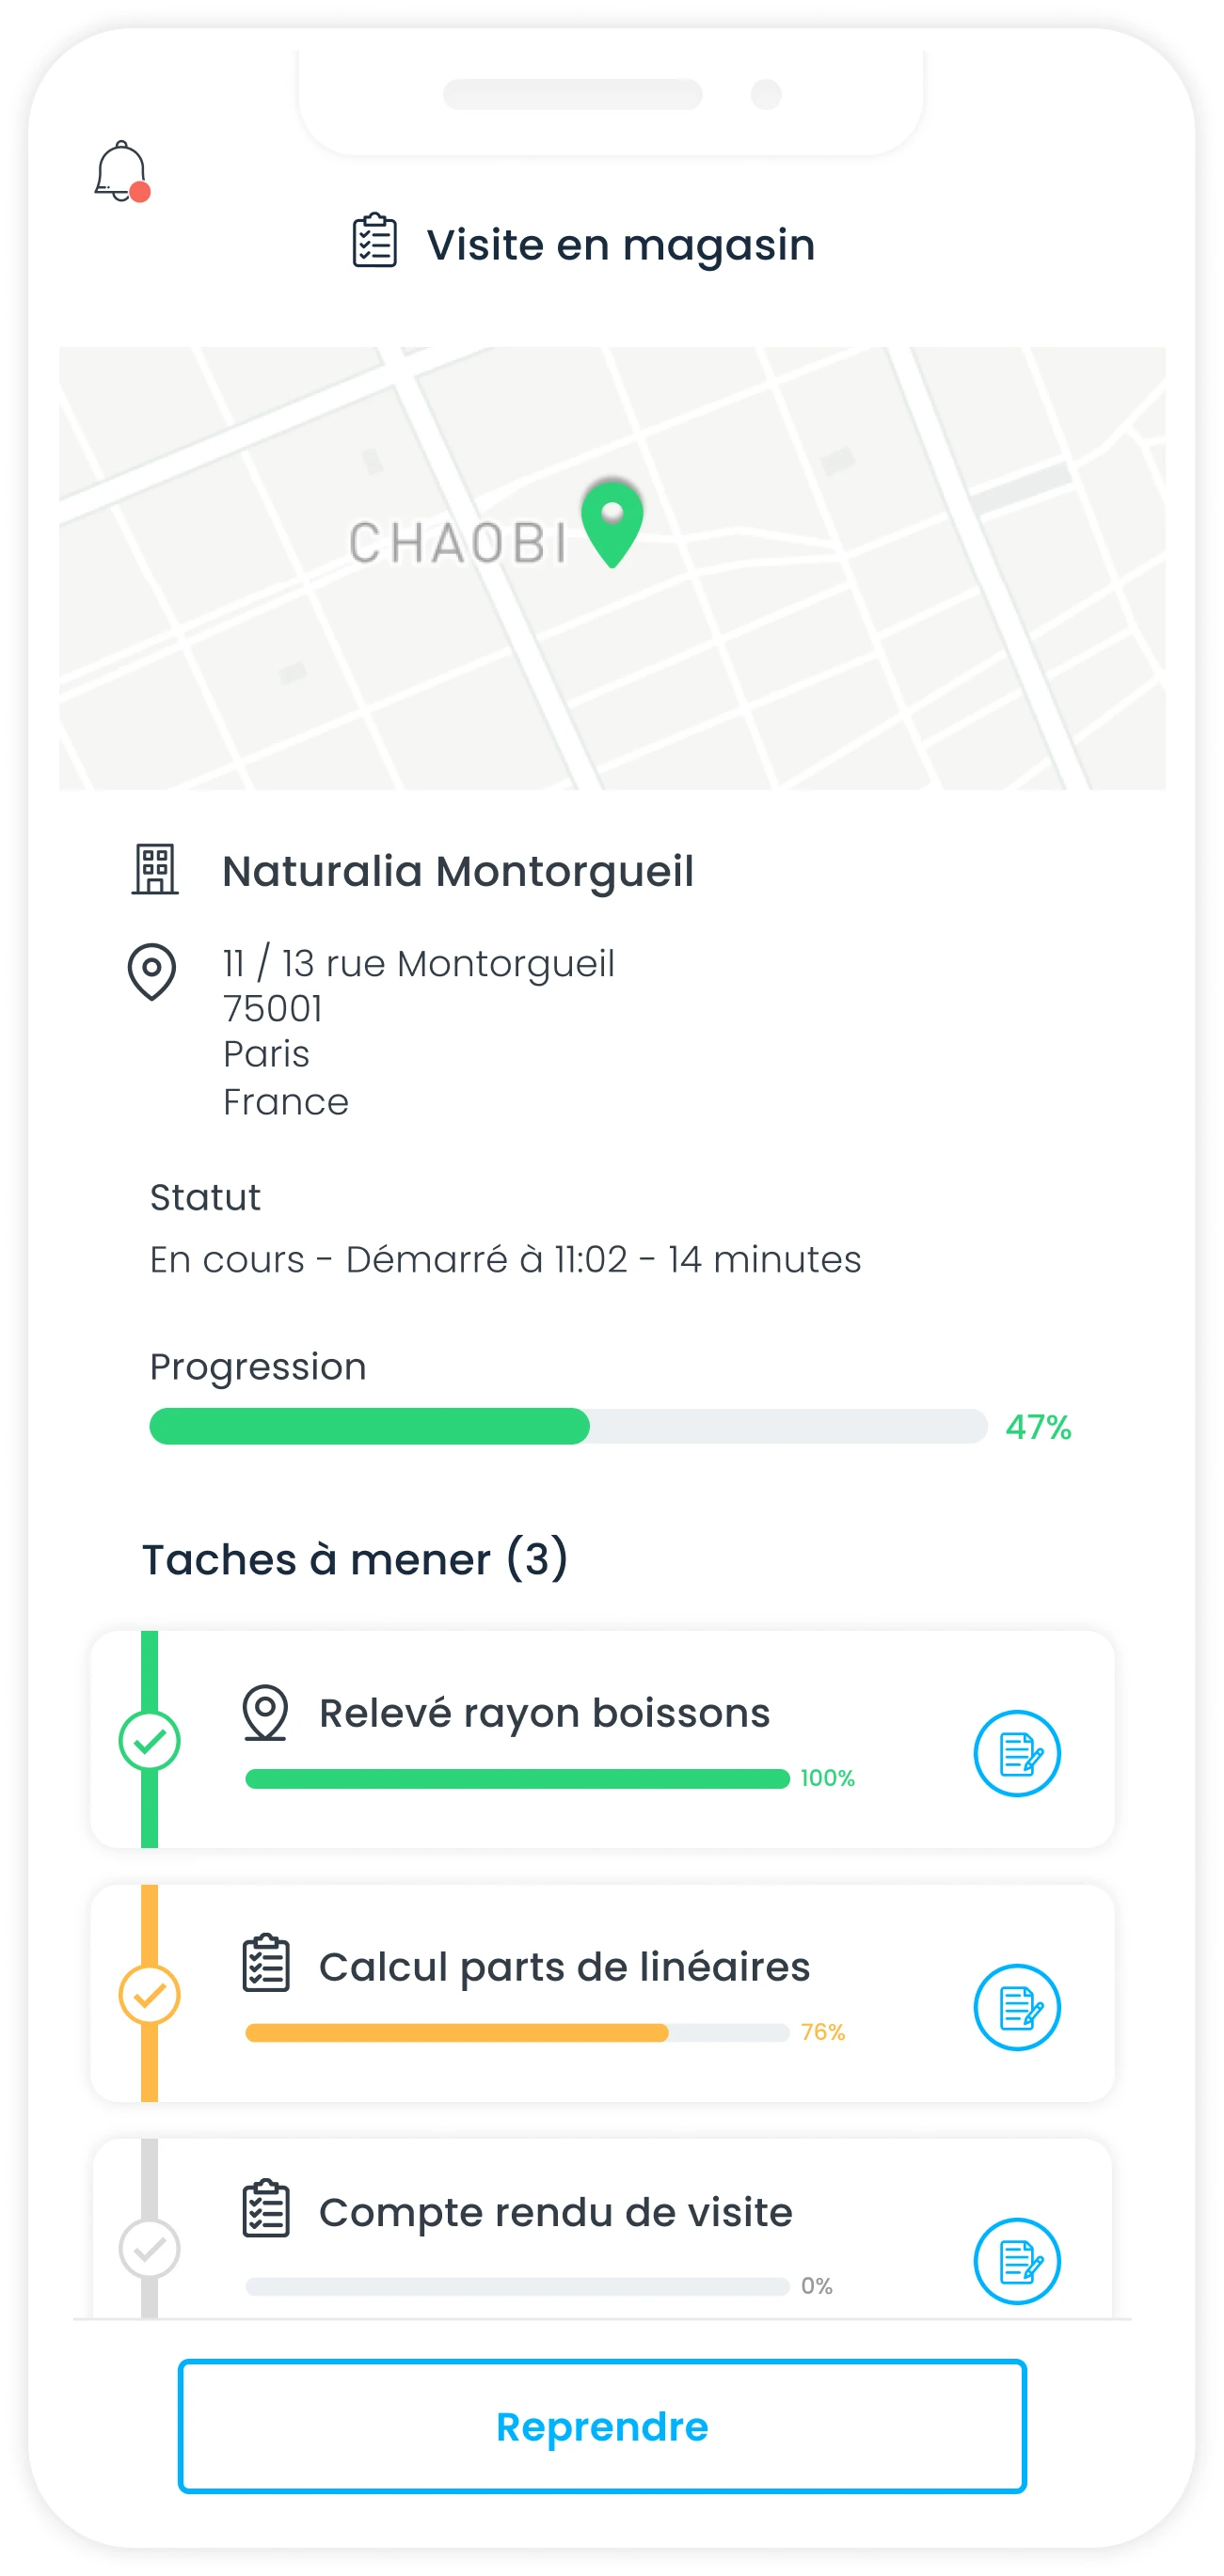
One of the main challenges in analyzing digital distribution is double placement, if your products are listed in multi-shelves. How do you link a store's distribution to several shelves? To do this, create a multi-shelf audit, which will allow you to collect your information by shelf. Then, the audit calculates your share of shelf and digital distribution for you.
The calculation can also be difficult if you are in multi-strata. The answer is similar.
Digital distribution is fundamental for analyzing your commercial performance, because it highlights the gap - positive or negative - between what you were able to negotiate in terms of digital presence (the number of references that the purchasing central recommends its stores to list) and what the stores ultimately decide to offer for sale.
The logic of trade marketing brings you to consider that you and your distributors share a common goal: maximizing sales. Thus, whether competitors have intensified their shelf-conquest strategy or your distributor has distanced themselves from your commercial goals, a digital distribution (D.t.N.) of less than 100% is a sign to be taken seriously. You must then nurture the commercial relationship, talk with the department manager, identify the reasons that led to this situation, and find common ground to list as many products as possible.
The KPI that helps drive the implementation of agreements
It is also important to take into account the deployment of your agreements. Each year, your distribution rate will change, based on the new agreements you have negotiated. The goal is then for new references to be put on store shelves as quickly as possible. Your sales force will therefore work in the field (store visits) to achieve this goal. The calculation of the product distribution rate will then be used to evaluate this work.
What we advise is to perform a retroactive calculation to get a picture as close to reality as possible. For example, you had 10 references in a banner in year n-1. You managed to negotiate 10 additional references for year n. Congratulations, your assortment is therefore increasing, from 10 to 20 products. The denominator thus changes from 10 to 20. We advise you to take this into account in the perception and analysis of your data. If you managed to maintain a D.t.N of 100%, meaning that the 10 items are present in n-1, you will then start year n at a D.t.N of 50%. The goal of your sales reps being to reach 100% again.
In this calculation, it is important to consider the absolute value, because the D.t.N can drop even though your number of references has increased. For example, you managed to have 15 products present in banner X. You therefore have a digital distribution of 75% (which is lower than in n-1), yet you have indeed increased the number of references on the shelf!
Data collection at the heart of D.t.N analysis
The use of forms tailored to retail, with the help of a CRM designed for the field, then proves decisive: by allowing you to collect business data at lightning speed from shelves and in a structured way, you give yourself the tools to objectively compare points of sale with each other.
If, in addition, you have cash register data to evaluate the sell-out, you have everything you need to convince your distributor to increase the number of your product references on their shelves, based on complete reports highlighting all performance factors between sell-in and sell-out.
In summary, calculating your digital distribution allows you to:
Verify if your distributors comply with the terms of the distribution agreement;
Verify if your distributors of retail stores promote your brand;
Negotiate with the department manager based on concrete facts;
Implement corrective actions based on the analysis of the causes of a drop in sales;
Equip yourself with reports based on the comparison of points of sale;
Identify correlations between field actions and commercial results;
Incentivize your sales reps with simple-to-understand indicators and clear objectives.
Interpretation and corrective actions
Once you have determined your digital distribution, it needs to be interpreted.
Indeed, the results can hide different scenarios, and you will sometimes need to discuss with the department manager or their hierarchy to get an accurate understanding of the situation.
However, we can list the most common causes of a digital distribution above or below 100%.
Digital distribution < 100%
Out of stock;
Negligent shelving, lack of management;
Intensification of competition / commercial actions to gain your share of shelves;
Poor commercial performance: customers are not choosing your products;
Disadvantageous placement (read Facing: negotiating the visibility of your products in retail);
Change in listing policy to your disadvantage;
Product incident (returns, recall, bad buzz, etc.);
Limited space: the point of sale is unable to optimize its shelf space, and some of your references are suffering because of it.
Digital distribution > 100%
Overperformance of your brand;
Competitors losing ground on your product ranges;
Alignment of your product assets with the listing policy of the banner or the store.
You now know the challenges of digital distribution, one of the most important indicators to track for a company that sells through indirect channels. You may have learned how to calculate it, interpret it, and have potential ways to hold sway in discussions with your distributors. Finally, your field reps must be aware of the importance of structured data collection at points of sale.
And for everything else, there is Sidely!
Margot has been working in Tech and SaaS for 8 years, with a multi-product experience that has given her a unique understanding of business challenges. On a daily basis, she analyzes, relentlessly tests, and relies on facts to shed light on market trends and help sales teams move forward.
See also

Artificial intelligence and field professions: what our 2026 studies reveal
Adoption, barriers, use cases: discover what our three studies reveal about the role of AI among sector managers, sales representatives, and foodservice sales reps.

CHR and RHF Sales Representatives: portrait of a relationship-driven profession in the era of data
Equipment, productivity, AI: discover the major trends for the HORECA and food service sales profession in 2026 through our field study.

Pharmaceutical Sales Representative in France: Portrait of a Field Job Under Pressure
Compensation, aspirations, AI usage: discover the major trends in the pharmaceutical sales representative profession in 2026 through our field study.

Area Sales Managers in France: who are they and how is the profession evolving in 2026?
Compensation, aspirations, AI usage: discover the major trends in the field sales representative profession in 2026 through our field study.
The area manager professions in 2026
Discover the trends, the challenges, and the key figures.