
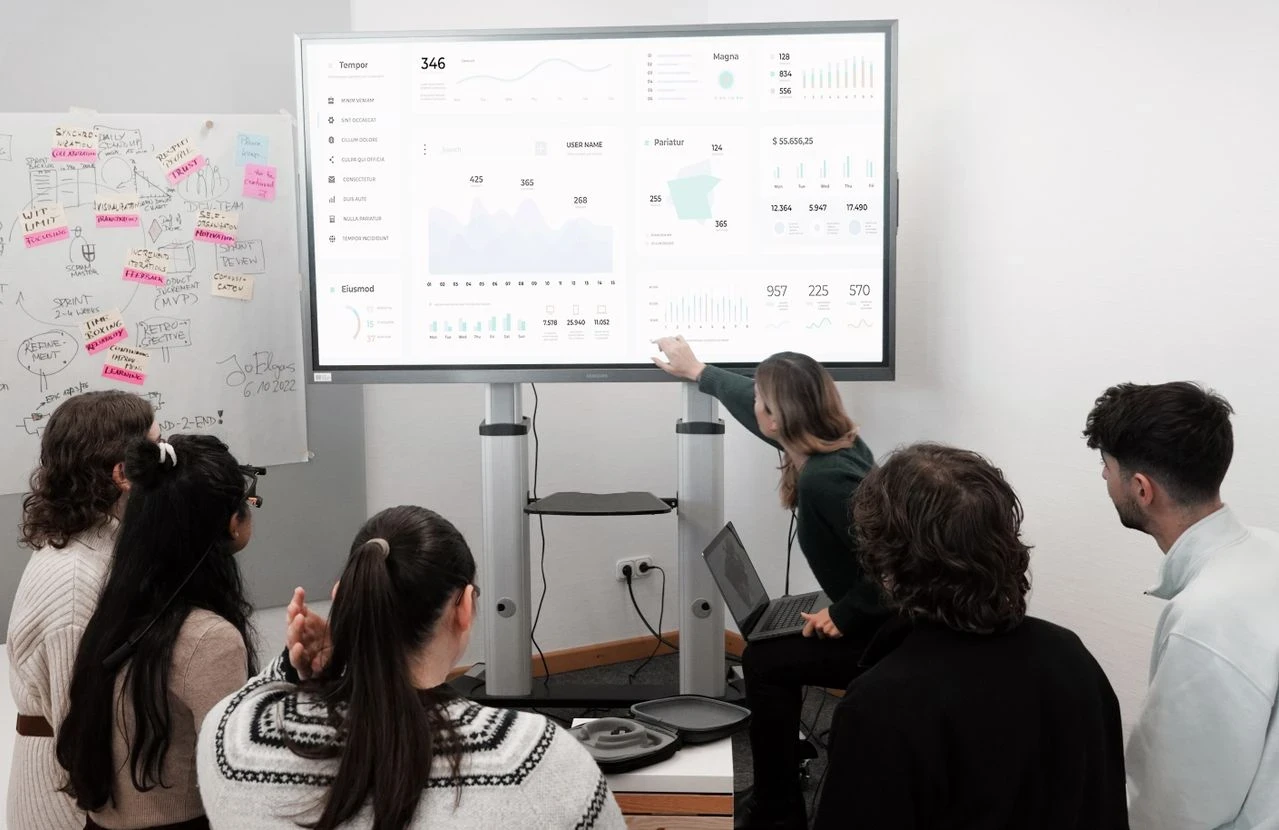
Simple Sales Dashboard: Best Practices
Which KPIs should you track in a sales dashboard? Revenue, field activity, conversion, pipeline: method and example to effectively manage your teams.

In short
8 min read
A sales dashboard is a strategic management tool used to visualize and analyze key performance indicators (KPIs) in real time.
Simplicity is key: it is best to focus on a few essential indicators per mission type to avoid information overload.
Integrating a CRM tool automates the creation and updating of reports, thereby ensuring the reliability of data based on actual activity.
Customization according to the business sector (FMCG, HoReCa, Foodservice, insurance) is essential to reflect field realities and specific business challenges.
An effective dashboard must include an immediate summary page, legible charts, and enable rigorous tracking of objectives to facilitate hierarchical decision-making.
Sales animation through meeting rituals based on these indicators is fundamental to engaging teams and improving their individual and collective performance.
A sales dashboard is a management tool used by businesses to monitor and analyze the performance of their sales activities. It provides a concise, visual overview of the key performance indicators related to sales and financial goals. It allows decision-makers to make informed, real-time decisions based on up-to-date data.
But building effective dashboards can be time-consuming and complicated. That is why, at Sidely, we believe it is better to design simple sales dashboards to optimize sales reporting and improve activity management.
So, in this article, we are going to explain how to do just that.
Sales dashboard: definition
A sales dashboard is a tool that allows you to visualize and track the sales performance of a company (macro level) or a team (micro level). It generally displays key performance indicators (KPIs) such as new sales, revenue, or the percentage of goal achievement, thus offering a global view of sales activity and goal tracking.
This "sales dashboard" comes in the form of several easy-to-understand charts, which are generally associated with graphs. The main objective is to help decision-makers - and sometimes sales representatives - make strategic decisions based on concrete data regarding sales activities.
The design and structure of the data can correspond to a template established by the company, which compiles charts from different departments in a harmonized way. Often, a sales tracking software (CRM) simplifies - or even automates - the creation and population of reporting dashboards.
In any case, sales dashboards are essential tools that help align sales efforts with the company's strategic goals, optimize individual and collective performance, and make the right decisions based on concrete data. They are therefore true tracking tools that must be updated in real-time or at regular intervals to reflect the most recent data.
Facilitate tracking for sales reps and managers
Different stakeholders are required to create sales dashboards, whether to track their own objectives, those of their team(s), or also to report to their manager.
The most frequent users of these dashboards are sales directors, sales managers, and the sales representatives themselves, whether they are sedentary (telemarketers) or mobile (field sales).
The following table presents the main objectives pursued by each of these roles.
Role | Sales Director | Sales Management | Field Sales Reps |
|---|---|---|---|
Main Goal | Strategy creation: define the company's sales strategies, evaluate overall sales performance, identify growth opportunities, and adjust strategies accordingly. | Team management: supervise sales teams on a daily basis, evaluate individual performance of team members, identify coaching or training opportunities, and allocate resources efficiently. | Tracking personal goals: track their own performance against the numerical targets assigned to them. |
Secondary Goal | Target monitoring: monitor the progress made by sales teams toward achieving set goals, and intervene if necessary to ensure goals are met. | Process optimization: identify bottlenecks in sales processes and work to resolve them to improve overall team efficiency. | Quality support: be evaluated and supported based on objective elements. |
Elements of a sales dashboard
Here are the different elements that can be found in a sales dashboard.
Key Performance Indicators (KPIs)
These are the essential metrics that allow you to track sales performance. These KPIs can vary depending on the company, its industry, and above all, the type of team concerned: inside or field sales reps, pre-sales or sales support teams, customer retention, etc.
However, there are essential indicators that all businesses must monitor. We offer a non-exhaustive list below:
Revenue (sales turnover);
Percentage of revenue goal achieved.
Total number of sales;
Number of appointments booked AND attended;
Closing rate;
Profitability of the service or sales rep;
Prospect-to-customer conversion rate;
Customer retention rate (loyalty / renewals);
Customer Acquisition Cost (CAC);
Sales cycle length (in time or number of meetings);
Customer satisfaction level (e.g., Net Promoter Score);
Additional sales made to active clients.
There are therefore many key indicators to track depending on the objectives you are pursuing. As we will see below, to simplify the analysis, we advise you to identify a few main indicators and focus on what matters most.
Visualizations and Graphs
Data is often presented in the form of charts or tables for quick and easy understanding. Line graphs, bar charts, pie charts, and pivot tables are commonly used to illustrate trends and comparisons.
Goal Tracking
Sales dashboards typically include indicators to compare current performance against past performance and thus track the evolution of set goals. This makes it possible to determine if the company is on track to achieve its sales targets.
Analysis and Insights
In addition to providing raw data, sales dashboards often offer analysis and insights into trends and correlations between different KPIs. This helps decision-makers understand the underlying causes of performance and identify opportunities for improvement.
The sales rep or manager can add contextual elements themselves. If you have chosen a simple dashboard format with only a few figures, your analysis can be added to the reporting email you send to your management or your wrap-up presentation. In any case, focus on the essentials and keep it concise. Executives are used to dashboards and don't have time to read novels!
Simplifying your dashboards
Presenting a large number of indicators in a report tends to make it more complicated to read and interpret.
To simplify performance analysis, you can divide the results tracking by type of operation, selecting a few key indicators for each.
Here are some examples of indicators to track by mission type.
Phone Appointment Booking | Field Sales Reps | Customer Satisfaction / Retention | Lead Generation |
|---|---|---|---|
Number of calls per day / Number of appointments booked / Percentage of meetings held / Closing rate on booked meetings. | Revenue generated / Percentage of monthly and quarterly target / Number of meetings held / Sales pipeline (revenue in progress). | Number of calls per day / Avoided churn / Saved revenue / Success rate / Net Promoter Score. | Number of leads generated / Conversion rate by sales reps / Cost per qualified lead / Return on investment. |
How to create a simple and effective sales dashboard
Now let's look at a simple method to help you build your sales performance tracking tool.
Step 1: Start with the main objective
Begin by focusing on the company's main objectives, such as increasing revenue or the number of clients, reducing acquisition costs, or optimizing the acquisition cycle, etc.
Step 2: Identify the indicators corresponding to this objective
For example, a company that wants to shorten its sales cycle could track the following indicators:
Percentage of one-shot closes (following the first meeting);
Average number of meetings held before closing;
Average number of meetings held per sales rep in the month.
Step 3: Identify and evaluate data sources
Check the feasibility of the reporting and the reliability of the data that will be used. To do this, you will need to ensure that the data is up-to-date and unbiased. Next, try to automate everything that can be, and if necessary, supplement with manual actions to pull in missing information.
Step 4: Find the ideal layout
A dashboard must provide a clear and immediate overview. That is why you must absolutely keep a summary page that your management can understand and interpret in a few seconds.
If needed, add tabs to your spreadsheet to look for deeper information, such as results by sales rep, by region, or secondary indicators. Some companies also choose to keep the monthly reporting history by dedicating one tab per month.
With modern CRMs, it is quite simple to test different layouts, especially when the software allows you to create dashboards using drag & drop!
Step 5: Set up a quality control process
It is possible to set up a quality department. This can aim to ensure the correct entry of data into the CRM or any other tool from which the reporting data is extracted; the CRM administrator can then be put in charge of this mission. In other cases, the sales dashboard itself can be checked for both substance and form: checking formulas, accuracy of data, consistency of results, relevance of tracked KPIs...
Step 6: Engage and onboard sales (or other stakeholders)
Setting up and sending a dashboard must lead to consistent actions: it is advisable to establish routine sales meetings that take into account the metrics set by the reporting. These rituals can be quick, but they are fundamental for sales engagement because they allow reps to feel involved in the strategy and own their objectives.
Be careful not to mix up tracking tools
To keep it simple and effective, organize your tracking tools logically and avoid confusing your routines.
For this, it is important not to confuse the sales dashboard with two other tools commonly used in the field of sales.
Forecast
For example, the sales dashboard does not replace the forecast declaration. The "forecast" is an animation ritual that allows sales representatives to announce to their management what they have in the pipeline at the beginning of the month. This short ceremony allows sales reps to remain realistic and transparent about their progress to date regarding the sales targets for the current period, and allows the manager to assess the starting situation. In the end, comparing results with the forecast helps analyze what happened during the period concerned and implement reactive measures.
Sales prospecting dashboard
Brands launching their activity sometimes set up a sales prospecting dashboard on Excel or Google Sheets. These situations are temporary, as companies sooner or later realize they need a sales CRM to facilitate - and sometimes automate - the generation of sales reports, and to eliminate many errors associated with manual data entry.
Which indicators to track according to your distribution network?
Not all sales teams are alike. And neither are all dashboards. A good report is not limited to tracking the same indicators as your neighbor: it must reflect the reality on the ground in your sector. Do you sell in supermarkets? in pharmacies? in the food service sector (horeca)? Your challenges are not the same, and neither are your distribution channels. So before building your sales dashboard, take the time to identify the right indicators to track according to your industry.
Here are suggestions for sales indicators to include in your dashboard, channel by channel.
KPIs to track in supermarkets (FMCG / grocery retail)
Here is an example of different metrics to track for a brand present in supermarkets:
Numeric Distribution (ND) by point of sale;
Numeric Distribution (ND) by sales rep;
Weighted Distribution (WD);
Share of shelf vs. competitors;
Revenue generated (sell-out / sell-in);
Cash register sales and evaluation;
Number of appointments booked in the month;
Sales visits conducted;
Number of active points of sale;
Out-of-stock rate on shelves;
Goal tracking (sales, activity...);
Annual sales growth vs. goals;
Average Weekly Sales (AWS);
Latest activity of sales reps;
Etc.
👉 The objective: guarantee your presence on shelves, boost sell-in, and analyze the impact of your sales activities.
If you want to know more about this topic, we wrote an article on the 5 KPIs to absolutely track in grocery retail.
KPIs to track in the HORECA sector (Cafés, Hotels, Restaurants)
Here is an example of different metrics to track for a brand present in HORECA:
Number of visits / routes completed
Number of new outlets activated
Order volume by product type
Restocking frequency / product rotation
Territory coverage rate (customers vs. prospects)
Conversion rate of visits → orders
Average order value per establishment
Most ordered products
Field customer feedback
Analysis of white spots (unvisited areas)
👉 The objective: maximize order frequency and field coverage.
KPIs to track in Out-of-Home Catering (OOH)
Here is an example of different metrics to track for a brand present in out-of-home catering:
Number of active touchpoints (canteens, caterers, institutions...)
Number of monthly orders per site
Customer loyalty rate
Share of volume by product range
Average basket per establishment
Response rate to tenders / requests
Sales volume by channel (distributor, direct, etc.)
Product presence rate in menus / offers
Frequency of sales routes
OOH revenue growth
👉 The objective: manage channel performance and secure recurring volumes.
KPIs to track in pharmacies/drugstores
Here is an example of different metrics to track for a brand present in pharmacies and drugstore networks:
Number of active pharmacies
Sales growth by product or range
Product shelf presence rate
Number of sales visits conducted
Average order volume per pharmacy
Top products by performance
Out-of-stock rate
Sell-out data (if available)
Number of new clients acquired
Field feedback on sales arguments
👉 The objective: guarantee product visibility and boost advice at the counter.
The case of specific industries
Insurance is not a distribution channel, but a fully-fledged industry with its own sales codes. To effectively manage your sales forces, you must track indicators aligned with your long cycles, conversion challenges, and retention goals.
Here is an example of different metrics to track for an insurer:
Number of leads generated per channel
Conversion rate of leads → clients
Number of sales appointments held
Average sales cycle length
Average value of a signed contract
Customer churn rate
Post-signature customer satisfaction rate
Individual performance per sales rep
Sales pipeline status by stage
Cross-sell / up-sell rate per customer
👉 The objective: structure sales performance and boost conversion.
These indicators are a foundation. The ideal is still to customize your dashboard according to your business challenges. And if you need a simple, mobile, and ready-to-use tool, we can support you. Request your demo here!
Margot has been working in Tech and SaaS for 8 years, with a multi-product experience that has given her a unique understanding of business challenges. On a daily basis, she analyzes, relentlessly tests, and relies on facts to shed light on market trends and help sales teams move forward.
See also

Artificial intelligence and field professions: what our 2026 studies reveal
Adoption, barriers, use cases: discover what our three studies reveal about the role of AI among sector managers, sales representatives, and foodservice sales reps.

CHR and RHF Sales Representatives: portrait of a relationship-driven profession in the era of data
Equipment, productivity, AI: discover the major trends for the HORECA and food service sales profession in 2026 through our field study.

Pharmaceutical Sales Representative in France: Portrait of a Field Job Under Pressure
Compensation, aspirations, AI usage: discover the major trends in the pharmaceutical sales representative profession in 2026 through our field study.

Area Sales Managers in France: who are they and how is the profession evolving in 2026?
Compensation, aspirations, AI usage: discover the major trends in the field sales representative profession in 2026 through our field study.
The area manager professions in 2026
Discover the trends, the challenges, and the key figures.