

Sales reporting: methods and tips
How to build an effective sales report? Key indicators, frequency, format, and examples to structure your sales team's performance tracking.

In short
5 min read
Sales reporting is essential for tracking, evaluating, and optimizing sales performance to achieve financial goals.
It enables effective team management by analyzing new sales, cross-selling, up-selling, and customer retention rates.
Implementation requires a rigorous methodology: defining objectives, choosing the right KPIs, collecting data, analyzing performance, and adjusting actions.
Automation using CRM tools (such as Sidely, Salesforce, HubSpot) or Business Intelligence tools (Power BI, Tableau) is recommended to ensure data reliability and save time.
To be effective, reporting must be regular, visual, limited to key indicators, and involve all stakeholders.
It is crucial to compare results against forecasts to identify discrepancies and implement appropriate corrective measures.
Every business activity needs to be monitored and evaluated. To do this, companies set up reporting systems in order to analyze what is happening on the ground (or online!) and to implement corrective or improvement actions. The goal is always to facilitate the achievement of sales and financial objectives.
But establishing effective reporting can be long and complex. Sidely has taken on the subject to help you!
Here is what you will find in this article:
We will start by defining the challenges of sales reporting;
We will see how to create the reporting that suits you, with an adaptive approach tailored to your industry;
We will list 10 tips from seasoned sales directors to ensure proper performance measurement;
What Sales Reporting Consists Of
Sales reporting consists of collecting and analyzing data on product or service sales, with the goal of improving the sales strategy and achieving the company's financial objectives.
It is generally prepared at the request of and intended for management.
Sales reporting can cover:
New sales (new biz);
Additional sales (cross-selling or up-selling);
Customer retention, or attrition (churn);
Overall sales activity.
It then involves creating sales dashboards to analyze sales performance and support strategic decision-making.
The objectives of sales reporting are generally to:
Evaluate the overall efficiency of the sales team;
Evaluate the individual performance of sales reps;
Track sales progress and identify trends;
Establish forecasts;
Identify pain points in the sales process;
Manage HR and the sales department's budget;
Improve sales pitches and techniques;
Consolidate a broader business activity report.
⚠️ Be careful not to confuse
This performance report therefore focuses on the results of individuals and teams, which differentiates it from the sales report, which is more suited to analyzing operations that do not require "human" sales actions, such as transactions carried out via an e-commerce site, or other automated business processes.
It is also necessary to distinguish sales reporting from the sales report, also called a call report or visit report, a document that records the important details of a contact with a prospect or customer (context, topics discussed, current offer, next planned steps, etc.).
How to Create a Sales Report
Here are some important steps to follow to create effective sales reporting.
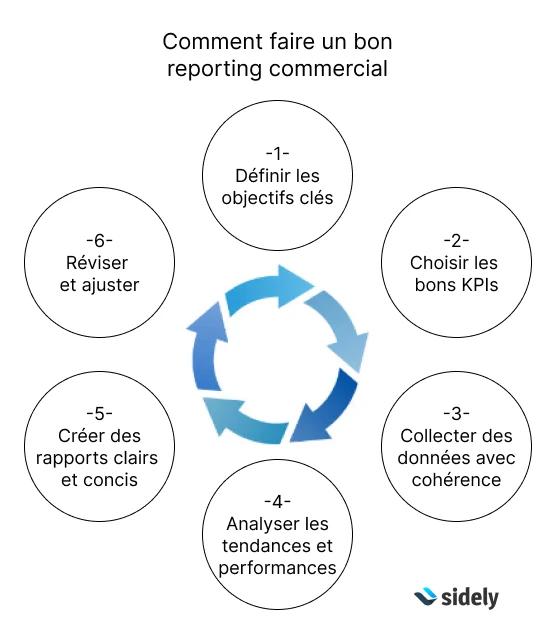
1) Define Key Objectives
Identify the primary objectives you want to achieve with your reporting. This generally means highlighting elements that show whether sales activity is aligned with the company's financial goals.
2) Choose the Right KPIs
Select the most relevant KPIs that effectively measure the performance of your sales activity. This could include data such as monthly sales, conversion rate, revenue per customer, etc.
3) Collect Data Consistently
Make sure to collect data consistently and accurately. Use appropriate tracking tools and ensure all data is up-to-date and reliable.
4) Analyze Trends and Performances
Once you have collected your data, analyze it to identify trends, strengths, and weaknesses in your sales activity. This will help you understand what is working well and what can be improved.
5) Create Clear and Concise Reports
Present your data in a clear and concise manner, using charts, tables, and visualizations to make the information easily understandable. Ensure your reports highlight key takeaways and action recommendations.
6) Review and Adjust
Regularly review your reports to ensure they remain relevant and useful. If necessary, adjust your KPIs or data collection method to better align your reporting with your business objectives.
→ These steps form a virtuous circle, shown in the diagram below.
Software and Automation of Performance Reports
On the technical side, there are three main trends for producing sales reports.
CRM Solutions
CRM stands for Customer Relationship Management. These are SaaS software programs that organize customer data collection, sales management, customer service, and customer relations. There are generic solutions like Salesforce, Pipedrive, or HubSpot, and industry-specific solutions like Sidely, the specialized CRM for field sales teams.
Discover our CRM comparison for national sales directors.
Business Intelligence
Business intelligence (BI) software comprises applications designed to transform raw data into actionable insights through the generation of easily understandable visual reports. These tools generally allow extracting data from various sources to centralize it into a database, then generating interactive dashboards. Examples include Tableau or Microsoft Power BI.
Spreadsheets
Lastly, small businesses sometimes create their sales reports manually using tools like Excel or Google Sheets. This practice has become rare, as SaaS tools are now financially accessible and simple to use.
🔧 When it comes to consolidating reports from data originating from different IT tools and software, the subject of CRM integrations quickly comes up! And for good reason, it is the best way to save time by automating the aggregation and structuring of reporting data. While CRM vendors usually provide integrations to third-party tools heavily used by their customers, you may need to develop custom programs to connect to unsupported applications. Caution must then be exercised regarding data security and privacy. Furthermore, do not forget that these programs will need to be maintained! Keep this in mind when choosing your reporting tools.
Adapting Sales Reporting to Your Industry
Now that we have seen the fundamentals of sales reporting, it is important to specify that the definition of key metrics is closely linked to your sector. To obtain relevant and actionable information, you must therefore start by adapting your sales reporting to your industry.
To better understand the importance of tailoring your analysis, here are 3 typical industry cases where it is essential to consider specific performance indicators.
Industry | Specific KPIs |
|---|---|
Pharmaceutical Industry (medical representatives) | Number of visits to healthcare professionals / Order volume from pharmacies VS number of appointments with doctors in the same region / Market share by product or therapeutic category. |
Consumer Goods (direct sales) | Number of product demonstrations performed / Conversion rate of demonstrations to sales / Sales volume by distribution channel (stores, events, etc.). |
B2B Service Sales | Number of sales meetings organized / Conversion rate of meetings to signed contracts / Value of contracts signed per period. |
Brands in Retail: How to Measure Your Performance
But the sector that wins the prize for the most complex commercial activity to evaluate is certainly large retail!
First, because retailers do not always share store sales figures with their suppliers, and second, because performance at points of sale can be explained by multiple factors (supply, assortment, merchandising, competition, promotions, etc.).
As a result, most brands send their field sales reps on tours of the stores carrying their products to collect information directly from the shelves.
Furthermore, performance indicators in retail are numerous:
Numeric distribution (ND) per point of sale;
Weighted distribution (WD);
Achieved revenue (sell-out / sell-in);
Number of appointments made in the month;
Completed sales visits;
Number of active points of sale;
Goal tracking (sales, activity...);
Annual sales growth compared to goals;
Average weekly sales (AWS);
Etc.
For this, it is essential that sales reps are equipped with a mobile CRM for retail store audits. Because, as we have seen, the relevance of a sales report depends first and foremost on the quality of the data that goes into it.
10 Keys to Effective Sales Reporting
Let's conclude with a list of tips to follow so that your reporting is effective and, above all, leads to action!
Define clear objectives: they must be precise, measurable, reliable, and reflect the performance expected by the organization;
Limit key indicators: a good sales report focuses on essential indicators. Deeper analysis is justified by an intuition or an unseen problem. But your sales reports should be simple to read and interpret;
Automate data collection: by using CRM or BI tools;
Ensure data quality: the accuracy of the data must be evaluable over time. Retain source data, and if necessary, set up regular quality control;
Incorporate visual representations: charts and tables make it easier to digest key figures;
Analyze trends and correlations: provide context to help understand changes and anticipate future movements. Is the continuous decline in sales of a product over the last six months related to the market, a lack of sales training, or new competitor products? etc.;
Involve stakeholders: all teams related to sales are concerned: sales, marketing, management, etc. Having sales reps fill out the CRM is a requirement, and the importance of their contribution must be understood by all.
Establish a regular reporting rhythm: reporting is a necessary ritual, it must be planned and completed on time;
Compare reporting to forecasts: at the beginning of the month, ask sales reps to provide a detailed status of the revenue they expect to generate. This pipeline allows reps to be realistic and transparent about their progress towards the goal, and gives the manager a clear picture of the situation. At the end of the month, compare actual results to forecasts to identify drivers of success or failure;
Leverage your analyses: management must drive motivation and authority based on sales reports. Reps must know that results are taken into account and that their management acts accordingly and proportionally, whether by rewarding results or implementing action plans to restore performance.
Margot has been working in Tech and SaaS for 8 years, with a multi-product experience that has given her a unique understanding of business challenges. On a daily basis, she analyzes, relentlessly tests, and relies on facts to shed light on market trends and help sales teams move forward.
See also

Artificial intelligence and field professions: what our 2026 studies reveal
Adoption, barriers, use cases: discover what our three studies reveal about the role of AI among sector managers, sales representatives, and foodservice sales reps.

CHR and RHF Sales Representatives: portrait of a relationship-driven profession in the era of data
Equipment, productivity, AI: discover the major trends for the HORECA and food service sales profession in 2026 through our field study.

Pharmaceutical Sales Representative in France: Portrait of a Field Job Under Pressure
Compensation, aspirations, AI usage: discover the major trends in the pharmaceutical sales representative profession in 2026 through our field study.

Area Sales Managers in France: who are they and how is the profession evolving in 2026?
Compensation, aspirations, AI usage: discover the major trends in the field sales representative profession in 2026 through our field study.
The area manager professions in 2026
Discover the trends, the challenges, and the key figures.