

Known and unknown shrinkage: challenges for brands
What are known and unknown shrinkage in supermarkets? How is it calculated, and what levers can be used to reduce it? A complete guide for brands and retailers.

In short
5 min read
Shrinkage represents the negative discrepancy between actual inventory and book inventory in mass retail, directly impacting the profitability of brands present in supermarkets.
Known shrinkage refers to identified and recorded losses (breakage, expiration, promotions, in-store tastings) logged in a shrinkage register.
Unknown shrinkage refers to losses of unidentified origin, primarily caused by shoplifting (75%), in-store consumption, or logistical and labeling errors.
The shrinkage rate is a key indicator, calculated by dividing the loss of revenue due to discrepancies by the total revenue multiplied by 100.
Brands play a crucial role in reducing losses by proactively collaborating with retailers through packaging optimization, staff training, rigorous logistics, and better contractual anticipation.
Shrinkage is the negative discrepancy between what you should have in stock and what the inventory actually reveals. Breakage, expiration, theft, management errors... these losses affect every link in the retail chain, and your brand is no exception.
Yet, the issue is almost always approached solely from the distributor's perspective. This is a mistake: when your products disappear from the shelves, your volumes—and sometimes your margins—evaporate.
This article covers everything you need to know: the definition of known and unknown shrinkage, a step-by-step calculation, the shrinkage rate, and what you can concretely put in place, both on your own and with your distributors, to reduce losses.
Definitions of known and unknown shrinkage
During the physical inventory that takes place at least once a year, it is common to find a discrepancy between the actual stock and the theoretical stock.
Shrinkage expresses the finding of a negative discrepancy between a counted (actual) stock and the theoretical stock.
But let's start by defining these two concepts:
Actual stock = stock present in the store + stock in reserve;
Theoretical stock = initial stock + quantity purchased - quantity sold.
The formula below evaluates shrinkage in quantities.
Total shrinkage = actual stock - theoretical stock.
[We will illustrate the formulas with concrete examples a bit further down in the article].
💡 Shrinkage is always less than 0. If the result is positive, it is referred to as an overage, meaning actual stock is higher than theoretical stock. Very rare, this surplus usually results from labeling errors. For example, a promotional product that displays the initial price and not the reduced price. Free products or those gifted by suppliers can also generate overage.
We can then determine the lost earnings in value, and evaluate it as a percentage of revenue. This is the shrinkage rate (see the dedicated section).
What is known shrinkage?
Known shrinkage measures the number or value of unsold products that are no longer in actual stock due to identified and recorded events in the shrinkage log.
The shrinkage log is a document in which products unfit for sale are reported.
Known shrinkage is linked to multiple causes:
Breakage;
Product damage during transport;
Product expiration;
Demonstration products;
Products used for in-store tastings;
Sales;
Promotions.
Price reductions are considered part of known shrinkage when looking at losses in value (revenue). In this case, shrinkage is not a problem, as it is generally strategic to sell off end-of-line products or those with short shelf lives. However, manufacturers and distributors can attempt to optimize stock to avoid having to lower retail prices.
Retail players generally use the term “breakage rate” because "damaged" products often make up a significant portion of known shrinkage.
What is unknown shrinkage and how is it calculated?
Unknown shrinkage corresponds to products that have not been sold and no longer appear in stock for unidentified reasons. This is therefore the loss of merchandise whose origin is not recorded.
This phenomenon is far from anecdotal and is rapidly worsening: according to a survey conducted in early 2025 by the collective RAS LE VOL, 82% of retailers surveyed were victims of theft in 2024, representing a 15.5% increase compared to 2023. On the official side, the Ministry of the Interior recorded more than 42,000 reported cases of shoplifting. This is an especially telling signal given that only one in two retailers still files a complaint, suggesting that the reality exceeds the reported figures.
It is calculated as follows:
Unknown shrinkage = total shrinkage - known shrinkage.
The most common causes of unknown shrinkage are:
Theft, which accounts for 75% of unknown shrinkage;
In-store consumption of the product;
Labeling errors;
Logistics issues.
You will find the detailed, step-by-step calculation in the example below!
How to calculate known and unknown shrinkage: example
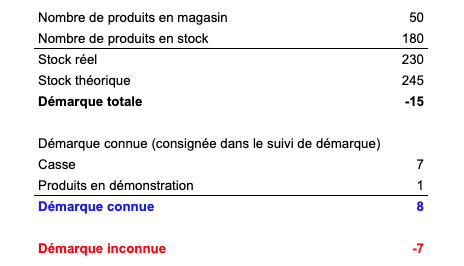
Let's analyze a specific item using an inventory report.
Initial data:
Products on shelf: 50
Products in reserve: 180
Theoretical stock: 245 units
1. Calculate the actual stock
Actual stock = shelf stock + reserve stock
Actual stock = 50 + 180 = 230 units
2. Retrieve the theoretical stock
Theoretical stock is what you should have in stock based on your recorded movements, prior to any physical inventory.
Theoretical stock = initial stock + quantity purchased − quantity sold
Theoretical stock = 145 + 700 − 600 = 245 units
Here, inflows and outflows are illustrative: what matters is that they result in the theoretical stock of 245, which you then compare to the actual stock.
3. Deduct total shrinkage
Total shrinkage = actual stock − theoretical stock
Total shrinkage = 230 − 245 = -15 units, meaning 15 missing units.
4. Add up the known shrinkage
Refer back to the shrinkage log:
Breakage: 7 units
Demonstration products: 1 unit
Known shrinkage = 7 + 1 = 8 units
5. Isolate the unknown shrinkage
Unknown shrinkage = total shrinkage − known shrinkage
Out of the 15 missing units, 8 are identified. The remaining 7 have no known cause.
Unknown shrinkage = 15 − 8 = 7 units, or -7.
Indicator | Calculation | Result |
|---|---|---|
Actual stock | 50 (shelf) + 180 (reserve) | 230 units |
Theoretical stock | Initial stock + purchases − sales | 245 units |
Total shrinkage | Actual stock − theoretical stock | -15 units |
Known shrinkage | Breakage (7) + demonstration (1) | 8 units |
Unknown shrinkage | Total shrinkage − known shrinkage | -7 units |
How to calculate and interpret the shrinkage rate
Counting missing units is not enough for management: 15 lost units do not carry the same weight depending on whether the product is $0.50 or $50. Converting shrinkage into value, and then comparing it to revenue, gives the shrinkage rate, which is the metric distributors and manufacturers actually track to compare departments, stores, or periods.
Let's go back to the previous example. With a retail unit price of $2.50 and a revenue of $5,500 over the period for this item:
Total shrinkage in value: 15 × $2.50 = $37.50
Shrinkage rate = revenue losses due to shrinkage / revenue × 100
Shrinkage rate = 37.50 / 5,500 × 100 = 0.68%
Be careful not to confuse three indicators that are often mixed up on the ground:
Indicator | What it measures |
|---|---|
Shrinkage rate | All losses (known + unknown) relative to revenue |
Breakage rate | Only known shrinkage of accidental origin (damaged or broken products) |
Unknown shrinkage rate | Only losses without an identified cause (theft, errors, etc.) relative to revenue |
Track these three rates separately: a rising breakage rate points to a handling or packaging problem, whereas a high unknown shrinkage rate points more toward theft or process failures.
The basics are in place. Now let's see what shrinkage concretely implies for your brand, and how to take action at your level.
Shrinkage in grocery retail: disparities across industries
Before asking how your brand can take action on product losses related to logistics, storage, or product shelving, it's worth noting an important point: the shrinkage rate, as well as the nature and origin of inventory discrepancies, differ depending on the products you offer for sale.
Electronic products and jewelry are highly exposed to theft, due to their generally high price points.
Fashion and apparel are also subject to this type of shrinkage, which must also factor in merchandise returns.
We can also mention health products, whose smaller dimensions tend to "facilitate" shoplifting.
It's worth noting that the inflation observed across nearly all sectors in recent years has been accompanied by an increase in supermarket theft.
In the food sector, shrinkage is generally related to product expiration, whether fresh or non-perishable. The breakage rate is higher in fresh departments than in others. Perishable foods lead to a high breakage rate due to the expiration of sell-by dates, hence the increased frequency of promotions. The EGalim 3 Law excludes fruits and vegetables from the threshold of resale at a loss, set at 10% of the effective purchase price of the products.
In other sectors, breakage represents the largest share of shrinkage. For example, household appliances often include fragile technological components, increasing the risk of damage during transport. Additionally, it is common to display products for demonstration, and these are often sold at a discount because they have already been unpacked, handled, etc.
Finally, let's remember that some industries experience seasonal shrinkage cycles, such as the toy department. During the Christmas season, theft and breakage are much more common than the rest of the year.
Fighting against known and unknown shrinkage
While your distributors (retail banners as well as points of sale) have more or less effective processes and habits for managing and reducing known or unknown shrinkage, you are fully justified in looking into the matter. After all, they are your products that are disappearing, and the distribution agreement can in some cases require you to assume or financially contribute to the missing revenue!
However, if your area managers are trained in best practices for reducing product loss, they can report them and work with department managers and other in-store teams to improve the measures set up (or lack thereof) for this purpose.
While in-store shrinkage cannot be completely avoided, it is always possible to reduce it. Beyond protecting yourself against potential economic losses, you also show your commercial partners that you are proactive in improving distribution processes and increasing profitability.
Generally speaking, it is important for your brand to anticipate shrinkage phenomena. Although most incidents or commercial events that generate loss happen at the distributor's end, you should take action on three levels:
Anticipation and negotiation: shrinkage is built into the distribution contract, and some retailers may ask you to contribute. Be vigilant and make sure you fully understand the terms;
Daily operations: define effective processes and train teams;
Verify that processes are followed, report and analyze the results.
Known shrinkage: causes and solutions
Indicator | What it measures |
|---|---|
Shrinkage rate | All losses (known + unknown) relative to revenue |
Breakage rate | Only known shrinkage of accidental origin (damaged or broken products) |
Unknown shrinkage rate | Only losses without an identified cause (theft, errors, etc.) relative to revenue |
Unknown shrinkage: causes and solutions
Issues encountered | Solutions |
|---|---|
Theft (or in-aisle consumption without purchase) | Encourage your distributors to implement deterrent methods: anti-theft tags, electronic labels, video surveillance. Raise staff awareness on the topic and on how to identify signs of shoplifting. Although these requirements seem to be the responsibility of the banner or point of sale, the experience and common sense of your area managers can make a difference: if they observe shortcomings or areas for improvement, action must be taken! You can also supply products already equipped with security packaging. |
Returned merchandise | Systematic verification of merchandise accompanied by proof of purchase. |
Labeling error. E.g.: discrepancy between the price shown on the shelf and the price at checkout | Ensure that logistics processes and used technologies are mastered throughout the supply and distribution chain. |
Logistics issue | Set up more regular inventories to pinpoint the sector(s) (delivery, storage, shelf) affected by shrinkage. When it is difficult to identify losses precisely, intermediate counting systems can be implemented to identify the critical phase. On your side, ensure that you systematically check the order when it is dispatched from your factory and when it arrives at your distributor. |
You are now familiar with each component of shrinkage in retail, whether known or unknown. While stores remain on the front line of these issues, you can act to limit losses for your brand and establish a win-win collaboration with your distributors. This will help combat shrinkage and show your commitment to achieving a shared goal: retail sales performance. For this, your ability to collaborate proactively with the distributor will play an essential role.
Margot has been working in Tech and SaaS for 8 years, with a multi-product experience that has given her a unique understanding of business challenges. On a daily basis, she analyzes, relentlessly tests, and relies on facts to shed light on market trends and help sales teams move forward.
See also

Artificial intelligence and field professions: what our 2026 studies reveal
Adoption, barriers, use cases: discover what our three studies reveal about the role of AI among sector managers, sales representatives, and foodservice sales reps.

CHR and RHF Sales Representatives: portrait of a relationship-driven profession in the era of data
Equipment, productivity, AI: discover the major trends for the HORECA and food service sales profession in 2026 through our field study.

Pharmaceutical Sales Representative in France: Portrait of a Field Job Under Pressure
Compensation, aspirations, AI usage: discover the major trends in the pharmaceutical sales representative profession in 2026 through our field study.

Area Sales Managers in France: who are they and how is the profession evolving in 2026?
Compensation, aspirations, AI usage: discover the major trends in the field sales representative profession in 2026 through our field study.
The area manager professions in 2026
Discover the trends, the challenges, and the key figures.