

How to calculate sales seasonality?
How to calculate sales seasonality? Step-by-step method, formula, numerical example, and tools to anticipate seasonal variations and manage your field activity.

In short
6 min read
Understand the concept of seasonality and its importance for operational management
Master the step-by-step methodology to isolate seasonal trends
Apply the mathematical formulas adapted to calculate coefficients
Analyze concrete examples to interpret sales variations
Discover key tools and indicators to anticipate future fluctuations
Some categories explode in the summer, others at Christmas. This is what we call sales seasonality: recurring and predictable variations in revenue depending on the time of the year.
But how can you identify it accurately? And above all, how can you leverage it to guide your commercial actions?
In this article, we explain how to calculate the sales seasonality of your products step-by-step, with concrete examples and practical tips to interpret the results.
Do you need to calculate your products' seasonality?
Before starting, ask yourself the question: are your products truly seasonal? There is no point in trying to calculate seasonality… if it doesn't exist.
We talk about seasonal products when demand varies significantly depending on the time of the year: weather, holidays, cultural events, or local habits.
Some products are highly seasonal, like ice creams, whose sales skyrocket in summer. Others are more moderately seasonal, like beer, which is sold year-round but experiences a notable peak during sunny days.
Seasonality therefore depends on several criteria:
The season
Summer: ice creams, water, sodas, beers, rosés, salads, barbecues (meats, sauces, charcoal), umbrellas, sunscreen, swimming pools, fans.
Winter: hot chocolates, soups, stews, fondues/raclettes, red wines, brown spirits, coats, heaters, Christmas decorations, toys.
Occasions and highlights
Back-to-school: school supplies, indoor sports equipment.
Holidays: champagne, foie gras, Yule logs, King's cakes, Easter chocolates.
Expiration dates
Fruits and vegetables according to harvest (strawberries in spring, tomatoes in summer, squash in autumn, citrus fruits in winter).
Dairy products linked to consumption peaks (creams and butters during the holidays).
If your sales are clearly impacted by the season, an event, or a local habit, it is in your best interest to measure your seasonality to better guide your activities. Otherwise, focus instead on underlying structural trends.
Why is it interesting to calculate your seasonality?
You sell several products, but not all of them react the same way throughout the year. Some are constant, others experience seasonal increases or drops. Identifying these dynamics gives you a strategic advantage to sell smarter.
Knowing the seasonality of your sales allows you to better manage your business, both in production and in commercial actions.
Here are the main benefits:
Anticipate demand peaks to adapt production and avoid shortages.
Identify low periods to launch promotions or test new references.
Argue with distributors using factual data: “my category skyrockets in summer, we need more facings during this period”. Of course, bring numbers and factual evidence to your meeting. You need to show how this can boost the store's revenue.
Prioritize visits to points of sale sensitive to the season (terrace bars in summer, restaurants in winter, supermarkets in coastal resorts vs. convenience stores in mountain resorts).
What do you need to calculate the seasonality of your sales?
For a brand to correctly calculate its sales seasonality, it must gather a certain amount of data and conditions.
Sales data
In order to have an analysis close to reality, you must have a sufficiently advanced history (2 to 3 years minimum) to smooth out anomalies such as an exceptional promotion, a sporting event, a period like COVID, or a stockout that penalizes you.
Choose data broken down by month, or even by week if the sector is highly sensitive to events, like beverages in the hospitality sector (On-Premise) during the football World Cup.
Accurate sales tracking
You will need to analyze your revenue, ideally in volume to measure real demand, and in value to measure the economic impact.
The ideal is to analyze both, because a volume can be strong but generate little revenue if the product is entry-level.
Some categories explode in the summer, others at Christmas. This is what we call sales seasonality: recurring and predictable variations in revenue depending on the time of the year.
But how can you identify it accurately? And above all, how can you leverage it to guide your commercial actions?
In this article, we explain how to calculate the sales seasonality of your products step-by-step, with concrete examples and practical tips to interpret the results.
What do you need to calculate the seasonality of your sales?
For a brand to correctly calculate its sales seasonality, it must gather a certain amount of data and conditions.
Sales data
In order to have an analysis close to reality, you must have a sufficiently advanced history (2 to 3 years minimum) to smooth out anomalies such as an exceptional promotion, a sporting event, a period like COVID, or a stockout that penalizes you.
Choose data broken down by month, or even by week if the sector is highly sensitive to events, like beverages in the hospitality sector (On-Premise) during the football World Cup.
Accurate sales tracking
You will need to analyze your revenue, ideally in volume to measure real demand, and in value to measure the economic impact.
The ideal is to analyze both, because a volume can be strong but generate little revenue if the product is entry-level.
Granularity adapted to your needs
Depending on the size of your brand, the products you sell, or the categories you address, you will not necessarily need to analyze sales in the same way. Here are some examples:
By category: beer vs. soft drinks
By product / reference: e.g., 33 cl blonde beer vs. IPA in kegs
By sales channel: supermarkets, hospitality (On-Premise), food service, e-commerce…
By region: useful for products sensitive to weather or local habits
External reference points
To correctly interpret seasonality, you must absolutely cross-reference your sales data with:
the commercial calendar: holidays (Christmas, Easter), sporting events, back-to-school, summer…
the weather (highly important for beverages, ice creams, summer/winter products).
promotions and marketing activations: a sales peak can come from a promo, not from natural seasonality.
It is this combination that makes it possible to distinguish natural seasonality from simple artificial peaks.
Steps to follow to calculate your products' seasonality
There you go, you have gathered your information. You can now calculate your seasonality. Here is how to do it step-by-step:
Calculate the annual average
If you have your monthly sales data, divide by the number of months in the year.
If you have your weekly sales data, divide by the number of weeks in the year.
Annual average = total annual sales / 12
Calculate the seasonal index by period
The seasonal index gives the relative weight of each month compared to the average.
Seasonal index = (month's sales / annual monthly average) x 100
Let's take an example.
Suppose a product with 120,000 annual sales (10,000 / month on average).
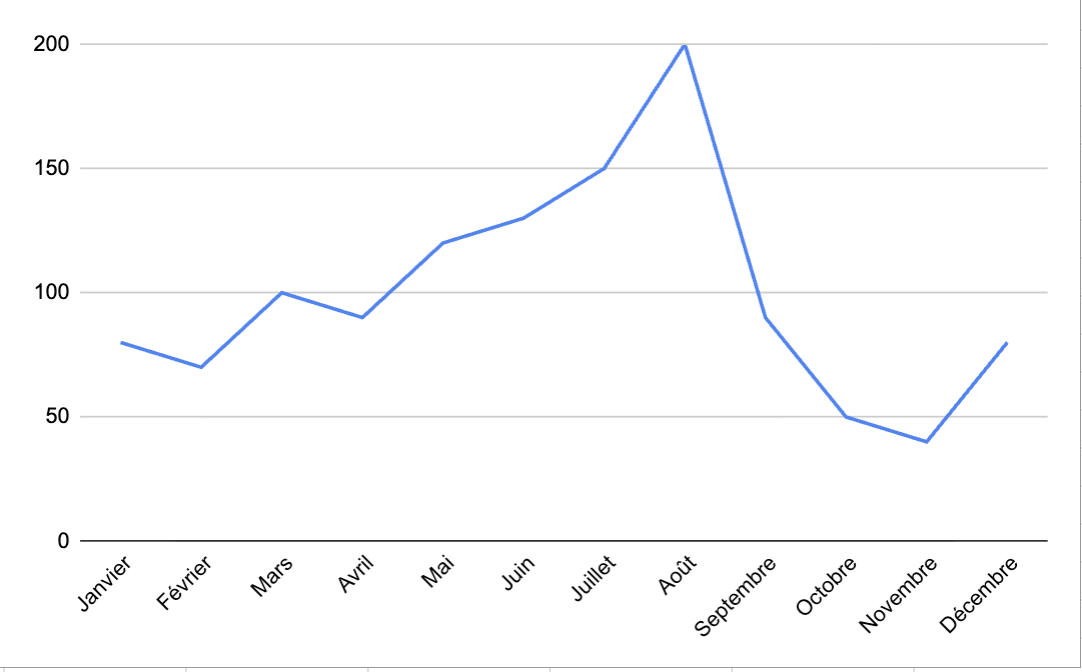
January: 8,000 sales → seasonal index = (8,000 ÷ 10,000) × 100 = 80
July: 15,000 sales → seasonal index = (15,000 ÷ 10,000) × 100 = 150
The seasonal index shows you that January is a weaker month (80% of the average), and July is a stronger month (150%).
Let's continue this example throughout the year:
January: 8,000 sales → seasonal index = (8,000 ÷ 10,000) × 100 = 80
February: 7,000 sales → seasonal index = (7,000 ÷ 10,000) × 100 = 70
March: 10,000 sales → seasonal index = (10,000 ÷ 10,000) × 100 = 100
April: 9,000 sales → seasonal index = (9,000 ÷ 10,000) × 100 = 90
May: 12,000 sales → seasonal index = (12,000 ÷ 10,000) × 100 = 120
June: 13,000 sales → seasonal index = (13,000 ÷ 10,000) × 100 = 130
July: 15,000 sales → seasonal index = (15,000 ÷ 10,000) × 100 = 150
August: 20,000 sales → seasonal index = (20,000 ÷ 10,000) × 100 = 200
September: 9,000 sales → seasonal index = (9,000 ÷ 10,000) × 100 = 90
October: 5,000 sales → seasonal index = (5,000 ÷ 10,000) × 100 = 50
November: 4,000 sales → seasonal index = (4,000 ÷ 10,000) × 100 = 40
December: 8,000 sales → seasonal index = (8,000 ÷ 10,000) × 100 = 80
Identify trends
Analyzing seasonal indices allows you to quickly spot strong and weak periods. If your data shows a peak in sales between May and August, with a particularly high-performing month of August, you know that your seasonality is summer-based.
Conversely, if sales drop significantly in October and November, these months can be targeted for commercial or corrective actions: promotions, in-store activations, or introducing new references.
These quieter periods can also become strategic windows to strengthen customer relationships by conducting visits, reviews, or preparations for the next season.
To make your analysis easier to read and share, it is recommended to display your results as a seasonality curve. This visualization allows you to identify demand peaks and drops to address at a glance.
Next, you will repeat the calculation for each month and each year, allowing you to understand whether your commercial actions had an impact.
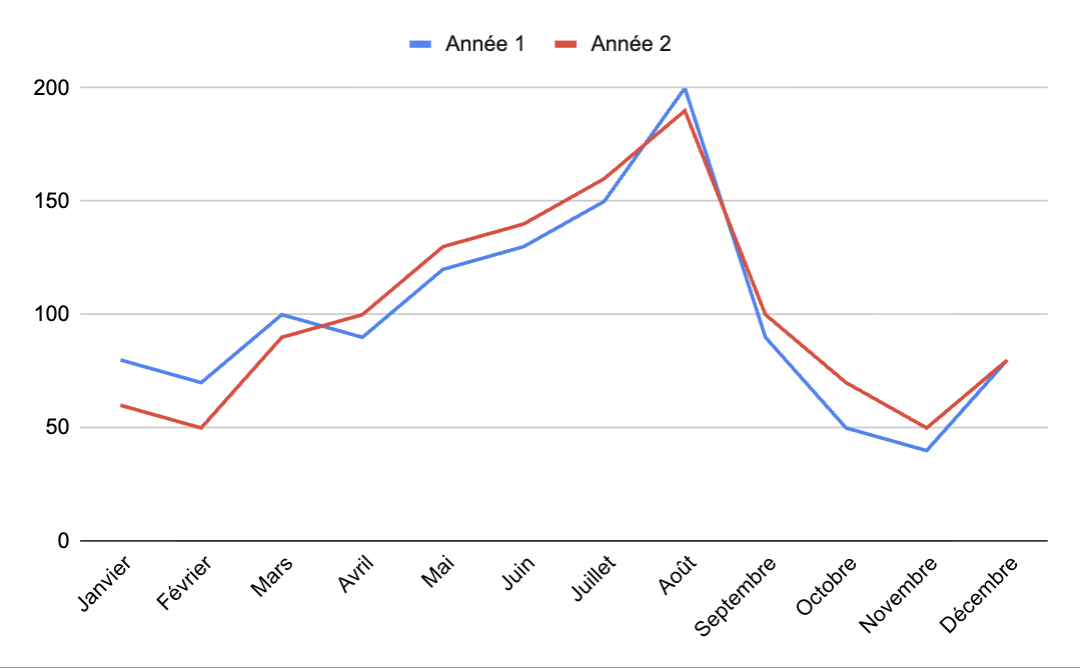
In our example, the promotional actions set up in October had an impact on your sales. This helps you understand that outside of peak sales periods, you can increase your sales volume by reducing prices.
It was by observing the still-fledgling digitalization of sales forces that Arthur envisioned Sidely. A graduate of EM Lyon and Le Wagon, he combines a rare commercial rigor with a true product culture. This dual expertise allows him to decipher the shifts in the profession and build a product that truly speaks to sales teams.
See also

Artificial intelligence and field professions: what our 2026 studies reveal
Adoption, barriers, use cases: discover what our three studies reveal about the role of AI among sector managers, sales representatives, and foodservice sales reps.

CHR and RHF Sales Representatives: portrait of a relationship-driven profession in the era of data
Equipment, productivity, AI: discover the major trends for the HORECA and food service sales profession in 2026 through our field study.

Pharmaceutical Sales Representative in France: Portrait of a Field Job Under Pressure
Compensation, aspirations, AI usage: discover the major trends in the pharmaceutical sales representative profession in 2026 through our field study.

Area Sales Managers in France: who are they and how is the profession evolving in 2026?
Compensation, aspirations, AI usage: discover the major trends in the field sales representative profession in 2026 through our field study.
The area manager professions in 2026
Discover the trends, the challenges, and the key figures.