

Speed up the listing of your products following central purchasing agreements
Discover how to optimize in-store product availability after central headquarters negotiations. Accelerate product rollouts.

In short
5 min read
Optimizing 'product descent' is crucial for quickly converting agreements negotiated at headquarters into actual in-store sales.
The time lag between signing the agreement and the product's actual presence on the shelves represents a significant loss in potential revenue.
It is essential to immediately integrate new assortments into the CRM to inform all teams and align sales objectives.
Updating performance indicators, particularly numerical distribution (ND), provides a realistic and motivating view of product presence following negotiations.
Tracking distribution in both weighted value (percentage) and absolute value is necessary for an accurate analysis of field performance.
Success requires proactive preparation of the sales force, targeted animation in strategic stores, and the use of real-time reporting tools.
Like every year, your agreements with central distribution organizations have been reviewed. If you have succeeded in increasing the number of references that will appear on the shelves of your retail partners, then congratulations!
But beware... Now, you will need to optimize the product rollout, i.e., ensure that the new references appear on the shelves as quickly as possible.
Today, Sidely tells you everything on this crucial topic for achieving your commercial objectives!
Listing in supermarkets (GMS): the issue of post-negotiation delays
Each year, the agreements linking you to your distributors are subject to renegotiation. Your main objective, as a brand, is to maximize the number of listed products in points of sale. Not easy! Especially since the Bruno Le Maire law, which tightens negotiation deadlines with your distributors.
Moreover, when you succeed, there is no question of resting on your laurels! Communication from headquarters to individual points of sale can take time, and this time can be costly (indeed, gaining listings has surely already cost you, so every day your products are not on the shelf, it means lost revenue!).
Added to this "top-down" communication delay are the hesitations of stores regarding the layout of their shelves, particularly due to constraints on available space. Finally, your competitors might also have negotiated their new assortment successfully...
In short, between the "theoretical" agreement you signed and the optimal distribution you dream of, there can be a significant gap. This is why you must immediately check that the new products negotiated at headquarters are indeed present on the shelves, and in the designated spot.
And if you are not proactive on this matter, you risk having surprises at the end of the fiscal year, because it is indeed sales volume that will suffer!
💡 The solution?
Involve yourself immediately by taking four strategic measures:
Integrate your new agreements / assortments into your CRM / Excel, so that all teams are informed;
Check the product rollout with a strategic panel (usually your sales front);
Prepare your sales forces, and create specific store check forms for the product rollout;
Update your commercial objectives and review your dashboards.
Current assessment and preparation of national listings
Getting the go-ahead from your distributor for your new assortment was costly. To make sure this investment pays off, you must check that the products are actually present on store shelves.
However, if your distribution network is extensive, you won't be able to visit all points of sale immediately.
Our first advice is therefore to send your area managers to visit your "top stores"—that is, those with the highest stakes (significant market share). If needed, discover how to optimize your route plans. This step will allow you to perform your shelf audits on a non-representative but crucial sample for achieving your goals. Checkout data can also give you visibility on what is being sold at the store level, rather than at headquarters.
However, integrating new products onto shelves changes the information to be tracked, reported, and analyzed. Your area managers risk losing a lot of time, or reporting outdated or incorrect information. It is therefore vital to update your forms, so as to optimize all shelf audits, from presence to merchandising, adapting them to the new agreements. This task can take time for the sales management, especially if audits need to be customized by tier, store, banner, etc.
This diagnostic stage logically leads you to deploy the strategy globally, i.e., to push correct product listings in all points of sale.
Field deployment and sales performance
This is where we talk about "product rollout" in supermarkets.
Indeed, once the number of product references per retailer is updated, the sales department must ensure that stores list the products concerned as quickly as possible.
To achieve this, some best practices should be integrated into your commercial strategy:
Communication: ensure the sales force is informed of the changes. When the number of listed products increases, it is an opportunity to communicate positively about a company success. Your area managers must understand the importance of such a victory, embrace it, and this positive feeling should stimulate their desire to participate in this great sales adventure!
Animation: the speed of execution of this new strategy will impact your sales and revenue. It is therefore crucial to set quantitative objectives for your sales team. Although the final objective remains numeric distribution (D.N.) - discussed in the next point -, it is appropriate to set intermediate targets, such as the number of visits, success rate, or even the number of appointments booked.
Motivation: clearly understood goals are more easily achieved. It is crucial to involve the sales force - even if outsourced! - and help them understand that everyone wins when the final goal is met;
Route planning: make sure to grade your customer base well, so you focus your efforts first on the accounts with the highest potential (your 80/20). If this is new to you, discover everything you need to know about numeric and weighted distribution, two indicators designed to evaluate and improve your distribution network;
Performance analysis: to help your sales reps improve productivity, equip them with the Sidely app, designed for shelf audits and sales routing. This is the final step of your plan: now that your sales force is ready for battle, let's see how to monitor your listing and availability goals!
Checking assortment renewal at store level
To ensure that commercial agreements signed with headquarters are respected by stores, and above all that product availability allows consumers to buy them when they do their shopping, you have access to specific reporting and key performance indicators.
Numeric distribution measures the number of products present in a store compared to the number scheduled by your agreements with the purchasing central. Any brand operating in mass retail must track this fundamental indicator because it reflects the proper execution of agreements signed with the brand, and ensures that product availability is optimal at the point of sale.
However, numeric distribution (D.N.) evolves every year to adjust to the number of references updated in the agreement for a particular retailer via its purchasing central.
To maintain maximum sales, brands must therefore update their commercial objectives and measurement indicators immediately after the agreement with the purchasing central changes.
For what reason?
Imagine your 2023 agreement with retailer X is for 5 products. Let's assume, for this example, that this objective is met across the entire network, meaning all products concerned are available on the shelves of every store included in the distribution agreement. Your D.N. (numeric distribution) is 100%.
Now, consider that the new agreement signed for 2024 requires stores to list 10 products. If you do not update your objectives, compliance with agreements (10 products on the shelf in a store) will result in a recorded D.N. of 200%. This is a false outperformance in the end, because 10 products listed in-store now corresponds to a D.N. of 100%.
By resetting the number of products in the assortment as soon as the new agreements are signed, area managers will find themselves with a numeric distribution of 50% during their first post-negotiation visit. During their audits, they will be able to see the curve rise. Besides being a more realistic reflection, it can also be a source of motivation for them. It's always nicer when numbers are green!
To ensure you track the correct numbers and make your reporting accurate and understandable, you must clearly distinguish the number of products from numeric distribution. This is why we advise tracking your distribution in weighted value (as a percentage) but also in absolute value.
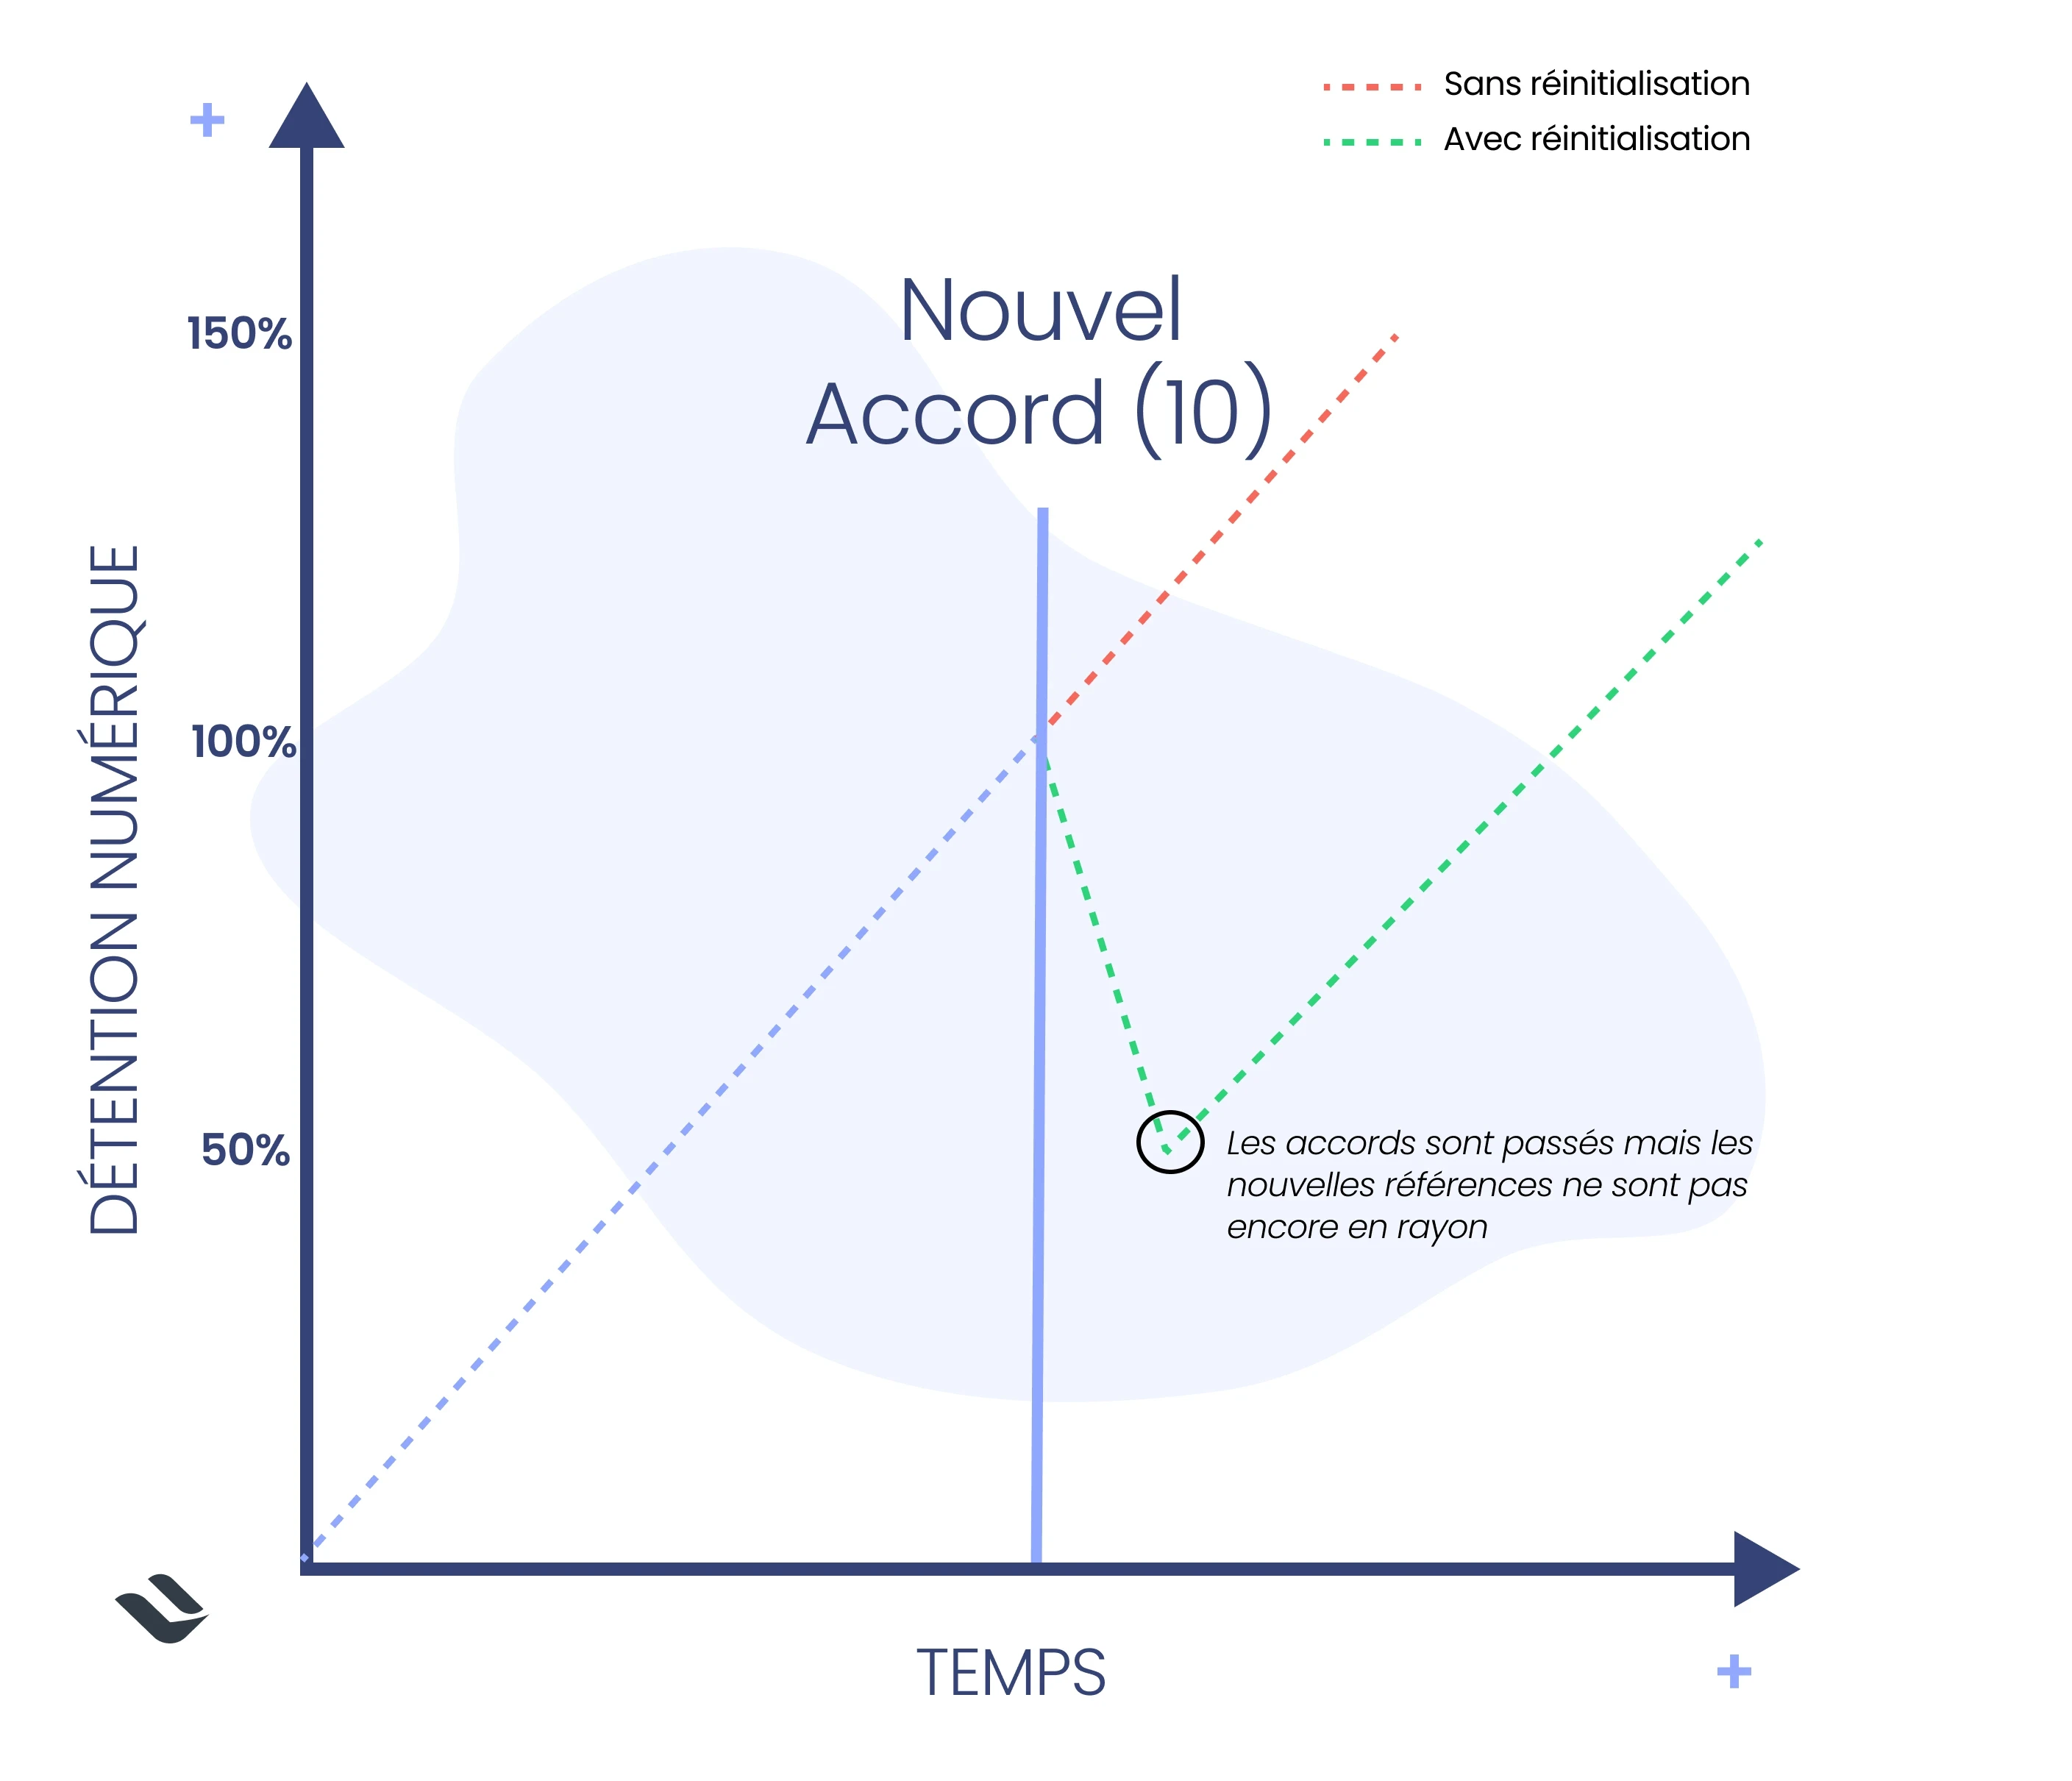
Let's continue with the same example. During the post-negotiation visit, your area manager only finds 8 of the 10 negotiated products. This brings their distribution to 80%, which is lower than that of 2023. However, not all is negative, since you succeeded in placing 3 more products on the shelves than last year.
Analyzing your presence in absolute value is also useful when figures decrease.
Take the example of a store of medium importance in your strategy, which is visited only once a quarter. During his last visit 9 weeks ago, the area manager recorded 4 products on the shelf against a target of 5 (compulsory assortment). The CRM therefore calculates a D.N. of 80%. In the meantime, the number of mandatory products increased to 10 (thanks to the new agreements). You can then modify your assortment in your CRM to 10 products for 2024 instead of 5 for 2023. Thus, the number of products found 9 weeks ago does not change (it's still 4!), but on his next visit, if the number of products present is still 4, the D.N. will drop to 40% (4 / 10). The area manager will therefore have an updated view when preparing his next business meeting.
You now have all the cards in hand to optimize and speed up product rollouts in points of sale. A well-managed plan consisting of preparation, evaluation, maximizing sales impact, and then monitoring with reliable reporting.
Margot has been working in Tech and SaaS for 8 years, with a multi-product experience that has given her a unique understanding of business challenges. On a daily basis, she analyzes, relentlessly tests, and relies on facts to shed light on market trends and help sales teams move forward.
See also

Artificial intelligence and field professions: what our 2026 studies reveal
Adoption, barriers, use cases: discover what our three studies reveal about the role of AI among sector managers, sales representatives, and foodservice sales reps.

CHR and RHF Sales Representatives: portrait of a relationship-driven profession in the era of data
Equipment, productivity, AI: discover the major trends for the HORECA and food service sales profession in 2026 through our field study.

Pharmaceutical Sales Representative in France: Portrait of a Field Job Under Pressure
Compensation, aspirations, AI usage: discover the major trends in the pharmaceutical sales representative profession in 2026 through our field study.

Area Sales Managers in France: who are they and how is the profession evolving in 2026?
Compensation, aspirations, AI usage: discover the major trends in the field sales representative profession in 2026 through our field study.
The area manager professions in 2026
Discover the trends, the challenges, and the key figures.