
How to calculate volume in liters?
How to calculate volume in liters for the HoReCa (CHR) and retail (GMS) sectors? Definition, formula, concrete examples, and practical applications to set your price per liter and manage your profitability.

In short
7 min read
Literage measures the actual volume sold (in liters), allowing for precise and comparable analysis beyond the number of units sold.
This indicator is essential in the on-trade sector (CHR) to harmonize varying packaging types (kegs, bottles, glasses) and align your teams with the operators' reference standards.
It facilitates sales prioritization by estimating the revenue potential of points of sale and measuring performance after a promotional campaign.
The calculation can be carried out using several methods: via bottles sold, glasses served, beer kegs, or cases, depending on the type of product.
Observing equipment, such as the number of beer taps, provides a reliable indicator for anticipating potential volume at a prospect.
Tracking literage over time allows for the calculation of key ratios, such as volume per customer or revenue generated per liter.
If you are a beverage brand, it is essential to track a concrete indicator: literage. This indicator simply corresponds to the volume sold, generally expressed in liters, in a given point of sale or network.
Unlike the number of units sold, literage allows a more precise and comparable view of your activity, especially in the On-Trade (CHR) sector where packaging varies greatly (bottles, kegs, cans, glass service, etc.).
Why track literage in the On-Trade sector?
Estimate the potential of a point of sale
Literage makes it possible to estimate the market size of an establishment. It helps you quickly differentiate a high-volume bar from a more confidential establishment. This allows you to prioritize your visits, investments, and negotiations.
Track a client's evolution
By comparing the literage before / after a listing or a commercial operation (for example, a product launch), you concretely measure the field performance of your brand. This will help you identify whether your brand is progressing in volume or stalling. It is a good complement to order volume.
Facilitate comparisons
With different formats and packaging, literage allows you to bring all volumes to a single unit and better analyze performances between products, brands, or clients.
Speak the language of On-Trade operators
On-Trade professionals think in liters, kegs, or glasses. Aligning yourself with this reference framework facilitates dialogue, negotiation, and the credibility of your teams.
Methods for calculating literage
Here are 4 practical methods adapted to your formats and objectives.
From bottles sold
You simply need to record the number of bottles sold per format and then convert each format into liters.
Conversion examples:
75 cl = 0.75 L
33 cl = 0.33 L
25 cl = 0.25 L
You then multiply the number of bottles by their equivalent in liters, and add up all the volumes.
For example:
40 bottles of 75 cl = 40 × 0.75 = 30 L
60 bottles of 33 cl = 60 × 0.33 ≈ 19.8 L
➡ Total literage = 49.8 L
From glasses served
This method is ideal for drinks sold by the glass (cocktails, soft drinks, wines, draft beers).
You simply need to:
Estimate the average volume per glass. For example, a glass of wine corresponds to 12 cl, a beer corresponds to 25 cl or 50 cl, a soft drink to 20 cl.
Multiply the volume by the number of glasses served.
For example, 120 glasses of wine at 12 cl = 120 × 0.12 = 14.4 L of literage.
Calculate potential literage with glasses served
This method is particularly useful during the prospecting phase, when the point of sale is not yet a client but shares information about its activity (volumes served, menu, footfall...). It allows you to forecast a potential literage if your brand were listed there.
The objective is simple: estimate the volume your drink could generate, based on its presence in cocktails, soft drinks, or draft beverages.
To do this, use the data shared by the establishment and the composition of the menu to anticipate the volume of your drink in a future listing. For example, if the bartender informs you that they sell 200 Moscow Mules a week, and you sell ginger beer, you can estimate the literage as follows:
200 x 0.12 (quantity per cocktail) = 24
➡ Literage = 24 L / week
➡ Over 1 month ≈ 96 L / month of potential for your ginger beer in the establishment
From kegs and taps
The literage per tap is a simple and effective method to quickly estimate the volumes of draft beer served in an On-Trade establishment. It relies on two essential parameters:
The capacity of the keg used (30 L, 50 L, etc.)
The rotation: number of kegs consumed per tap, per week or per month
To calculate the literage, use the following formula:

Let's look at some concrete calculation examples:
Neighborhood bar (low rotation): 1 keg of 30 L per tap / week → ≈ 120 L per month / tap.
Lively pub (high rotation): 3 kegs of 50 L per tap / week → ≈ 600 L per month / tap.
Restaurant with low draft beer flow: 1 keg of 30 L per month / tap → ≈ 30 L per month / tap.
To help your sales reps quickly assess the potential of a point of sale, you can establish an indicative scale according to the observed flow:
1 tap = < 50 L / month → low flow (classic restaurant).
1 tap = 100 to 150 L / month → medium flow.
1 tap = 300 to 600 L / month → high flow (festive bar, pub).
Calculate potential literage with beer taps
During a meeting with a prospect, one of the best ways to estimate their commercial potential is to observe their draft dispensing equipment.
The taps are indeed a reliable indicator of the potential volume your brand could reach if it were listed.
By identifying the number of taps and their rotation, you can quickly estimate the volume opportunity of an establishment, and prioritize your sales actions accordingly.
Take the example of a bar where each tap is dedicated to a beer brand, located in Lille. We estimate an average rotation of 1 keg of 30 L per tap and per week.
30 L x 4 = 120 L per month for each beer brand.
From cases sold
This calculation method is more ideal for non-pressurized beverages (juices, teas, waters, sodas, wine...).
To do this, simply total the liters contained in each case, and multiply them by the number of cases sold.
For example, if you sell cases of 6 bottles of 75 cl, you have 4.5 L per case. If you sold 10 cases in an establishment last month, you have a literage of 45 liters.
Tracking literage over time
The global literage is not just a product-by-product record, but a performance tracking indicator at the level of an establishment, a region, or a period.
Calculate literage by period
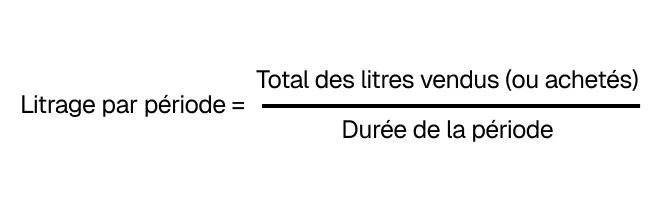
👉 This gives an average volume sold per week, per month, or per quarter.
Example:
January: 1,200 L of beer sold
➡ Monthly literage = 1,200 L / month
➡ Weekly literage ≈ 300 L / week
Calculate literage in relation to turnover

👉 Allows you to compare the value generated per liter between different beverages.
Example:
1,200 L of beer sold for €6,000 of turnover
➡ Average price per liter = 6,000 ÷ 1,200 = €5/L
This shows whether a premium reference generates more value than an entry-level one, beyond volumes.
Calculate literage by number of clients (or covers)
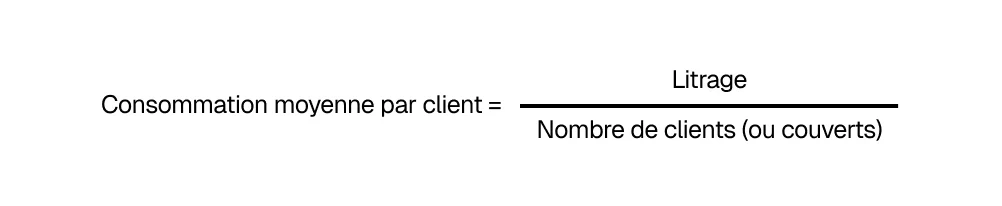
👉 Serves to measure the penetration of beverages in the client experience.
Example:
Restaurant: 800 covers over the month
Soft drinks literage = 400 L
➡ Average consumption = 400 ÷ 800 = 0.5 L / client
This helps identify:
if the drink is well integrated into the meal,
or if the potential is under-exploited (e.g. upsell possible).
How can these calculations help you?
- Compare points of sale with each other (festive bars vs restaurants).
- Track evolution over time (impact of promotions, seasonality, weather).
- Negotiate with clients by talking in price per liter or in average consumption per client (very concrete terms for a bar or restaurant owner).
The data to collect to calculate literage
To effectively track your On-Trade literage, you must rely on field records made by your sales reps. This involves structuring an adapted record sheet, which allows you to convert the gathered information into volume (liters).
Here is the essential information to collect per product:
Brand / Reference
Type of container (keg, bottle, can, etc.)
Unit capacity (in cl or L)
Number of units present, sold, or ordered (depending on the indicator tracked: ND, sell-in, sell-out…)
If you are a beer brand, you can also record the number of taps present.
Let's take two examples:
Beer brand
Format: Stainless steel keg
Capacity: 30 L
Kegs sold over the period: 3
➡ Literage sold = 3 × 30 L = 90 L
Soda brand
Format: Aluminum can
Capacity: 33 cl (0.33 L)
Cans sold: 120
➡ Literage sold = 120 × 0.33 = 39.6 L
Other elements to record in the field
Beyond the product, certain contextual pieces of information are key to estimating potential or comparing establishments:
Type of establishment: bar, brasserie, restaurant, hotel…
Equipment: number of taps, fridges, fountains, machines…
Product offering: cocktails offered, presence of soft drinks, number of beer references…
Estimated footfall: low, medium, or high (small bar, high volume, etc.)
Standard consumption assumptions: 1 tap = 120 L / month, 1 cocktail = 0.10 L of soft drink, 1 keg = 30 or 50 L… By structuring this data in your CRM or your field reports, you will be able to reliably track literage, compare points of sale with each other, and identify the best business opportunities.
For the past five years, Corentin has supported more than 200 sales teams, making him one of the longest-serving members of the company. He has seen the product evolve alongside the industries he supports, giving him a deep understanding of actual use cases. Between onboarding calls and training sessions, he has built up rare, hands-on expertise: knowing exactly what saves teams time.
See also

Artificial intelligence and field professions: what our 2026 studies reveal
Adoption, barriers, use cases: discover what our three studies reveal about the role of AI among sector managers, sales representatives, and foodservice sales reps.

CHR and RHF Sales Representatives: portrait of a relationship-driven profession in the era of data
Equipment, productivity, AI: discover the major trends for the HORECA and food service sales profession in 2026 through our field study.

Pharmaceutical Sales Representative in France: Portrait of a Field Job Under Pressure
Compensation, aspirations, AI usage: discover the major trends in the pharmaceutical sales representative profession in 2026 through our field study.

Area Sales Managers in France: who are they and how is the profession evolving in 2026?
Compensation, aspirations, AI usage: discover the major trends in the field sales representative profession in 2026 through our field study.
The area manager professions in 2026
Discover the trends, the challenges, and the key figures.