

How to calculate the optimal size of your sales force?
How to calculate the optimal size of your field sales force? Methods, formulas, and examples for effectively sizing your teams.

In short
7 min read
Accurately sizing the sales force is crucial for balancing profitability and team performance.
The sales targets method allows for estimating staffing needs based on target revenue, adjusting calculations according to the profile (senior/junior) and seniority of the recruits.
The calculation by workload and potential relies on sectorization to guarantee a balanced commercial effort across each geographical territory.
Two workload-based approaches exist: by annual visit target or by target visit frequency within your store network.
The marginal analysis method helps identify the optimal size by recruiting up until the cost of the last sales representative exceeds the gross margin they generate.
Integrating real-world constraints—such as travel time, administrative tasks, unforeseen events (absences), and managerial thresholds—is essential for refining the sizing.
There is no single answer; the ideal size depends on your sector, your commercial coverage strategy, business goals, and portfolio structure.
As a sales director, your priority is to achieve your profitability goals.
Yet, your main expense item is often the salaries of your sales reps. Hence the crucial importance of sizing your sales force with precision.
An oversized team leads to overstaffing... and sales reps who do not generate enough value.
An undersized team puts your staff under pressure... and makes your goals hard to reach.
So, what is the optimal size of your sales force?
There is no single answer. It all depends on your industry, your coverage strategy, your business goals, and the structure of your portfolio.
But there are rigorous methods to calculate it.
In this article, we present three concrete approaches to effectively size your sales force.
It's up to you to choose the one that best fits your context.
Let's get started.
Calculating based on your sales objectives
This calculation technique is basic and more suited for inside sales teams, but it can be interesting for you when your main objective is to sign new points of sale.
Take the new revenue targets you need to achieve over the year. Divide this amount by the potential sales volume per sales representative.
For example, if your revenue target is 2 million on new sales and point-of-sale openings, and the signing capacity per sales rep is €400,000, the optimal size of your sales force is 5 sales reps.
2,000,000 / 400,000 = 5

Be careful, though! Profiles differ and therefore make this calculation more complex. A senior sales rep will sign more than a junior. A person who has just joined your team will not be able to sign the same amount as a sales rep who has been working with you for two years.
There are other criteria to consider in your calculations, especially if you plan to recruit.
Let's take the previous example. Your goal is 2 million euros in new revenue, and you currently have 3 sales reps in your team, including one junior. The junior is capable of signing €350,000, while your two senior sales reps can open points of sale for a sell-in promise of €450,000. You can therefore reach €1,250,000 with this team.
Knowing that recruitment takes an average of 3 months, if you start in January (to keep things simple) and a junior profile is operational after 4 months and a senior profile after 2 months, a senior sales rep will bring you €262,500 in the first year and a junior €146,000.
If you are aiming for two million in revenue, you can hire 2 senior profiles and one junior profile. Instead of 5 sales reps, you will actually need 6 sales reps to reach your goal.
This calculation technique should be taken with a grain of salt, as it is quite basic in its approach and, above all, does not take into account travel times or the specificities of the field sales representative profession. Indeed, field sales reps have a sales role when signing new clients, but they must above all retain existing ones! And that is calculated differently.
Calculating based on workload and sales potential
Every territory is unique.
Commercial density varies from one sector to another: some regions are vast but sparsely populated, while others, like city centers, concentrate a large number of retail outlets in a small area.
Your brand awareness also plays a role: it either facilitates or complicates your sales reps' work.
And depending on your objectives (opening new accounts or retaining existing customers), the workload will not be the same.
👉 All these elements fall under one and the same logic: territory mapping.
The objective?
To ensure that each geographical area represents an equivalent commercial effort.
It is by estimating this effort that you can then calculate the optimal size of your sales force.
And of course, to maintain high profitability on each visit, it is essential to support your teams to avoid unproductive visits.
Two methods to calculate the right team size
Depending on your context, you can choose one of the following two approaches:
Method 1: By visit target
Method 2: By retail network size and target visit frequency
We detail both right after.
In both cases, it is important to calculate the average time of a visit:
On average, in supermarkets (GMS), sales reps take 1 hour to visit a store and visit 25 retail outlets / week.
On average, in hotels/restaurants (CHR), sales reps take 40 minutes to visit an establishment and visit 35 retail outlets / week.
For the rest of the calculations, we assume that the sales rep works 35 hours per week, 45 weeks per year. Excluding vacations, this amounts to actual work of 40 weeks per year.
You can easily adapt these figures to your business and field reality.
Calculating by visit target
For this technique, we start from your visit objectives and the number of visits your sales reps are capable of performing.
If you don't have this last figure defined yet, you can establish an individual capacity model, meaning defining parameters (adjustable according to your field reality):
- Visit mix (replenishment / development / negotiation) → calculate a weighted average duration.
- Non-customer time per stop: average travel time and administration (orders, photos, check-out).
- Organization: field hours/day, field days/week, active weeks/year.
- Reality factor (utilization): no-shows, closures, unexpected events.
Here are some formulas that will help you:
- Total time per stop = average visit duration + travel/stop + admin/stop.
- Visits/day = (field hours/day × 60 × utilization) ÷ total time per stop.
- Visits/year/sales rep = visits/day × field days/week × weeks/year.
Here is the formula to follow to calculate the ideal size of your sales force relative to your visit targets:
Visit target per year / Visits per year per sales rep = Sales reps
Let's put this formula into practice.
Suppose you have an objective of visiting 12,000 retail outlets this year.
In CHR (Hotels/Restaurants),
Sales reps visit an average of 35 retail outlets per week, which theoretically equals 1,353 visits / year.
12,000 / 1,353 = 8.86
Conservative capacity: 10 sales reps.
Theoretical capacity: 9 sales reps.

In GMS (Supermarkets),
Sales reps visit an average of 25 retail outlets per week, which theoretically equals 1,000 visits / year.
12,000 / 1,000 = 12
Conservative capacity: 13 sales reps.
Theoretical capacity: 12 sales reps.
The conservative capacity takes into account sick leave, hypothetical issues, delivery delays... all the hazards that mean your sales reps won't be 100% active all year round.
Calculating by visit frequency
For the calculation technique by visit frequency, you take into account the number of times you must visit each point of sale, relative to the total number of retail outlets you have in your store network.
Here is the formula to follow to calculate the ideal size of your sales force relative to your visit frequency:
((Number of establishments × Frequency/year) ÷ Visits/year/sales rep) = sales reps
Let's put this formula into practice.
Here is an example in CHR,
Network: 3,000 establishments
Breakdown: 60% bars, 30% restaurants, 10% hotels.
Bars: 1,800
Restaurants: 900
Hotels: 300
Target frequencies: bar 4/year, restaurant 3/year, hotel 2/year.
Calculation of visits/year:
Bars: 1,800 × 4 = 7,200
Restaurants: 900 × 3 = 2,700
Hotels: 300 × 2 = 600
Total = 7,200 (Bars) + 2,700 (Restaurants) + 600 (Hotels) = 10,500 visits/year
As a reminder, your sales reps have a visiting capacity of 1,353 visits / year.
10,500 / 1,353 = 7.76
Conservative capacity: 9 sales reps.
Theoretical capacity: 8 sales reps
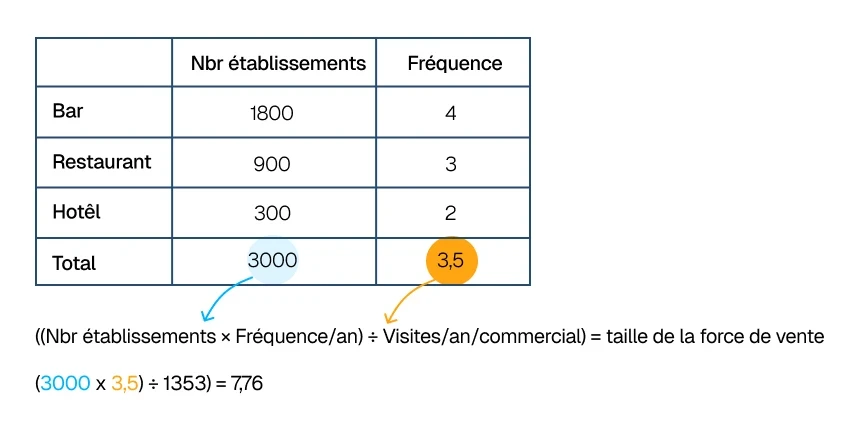
You can also run a scenario with an increased frequency for ambassador accounts. To do this, take the same network and add the number of ambassador stores where you want to increase your number of visits per year. In our example, we will take 15% ambassadors at 6 visits/year. The rest remains according to the previous scale. Assume that 70% of the ambassadors are bars, 25% are restaurants, and 5% are hotels.
Here is how you can proceed:
Remove the ambassadors from each "standard" category.
Calculate their visits at 6/year.
Recalculate the visits of non-ambassadors using standard frequencies.
This typically results in a +10% to +20% increase in visits/year depending on the share of ambassadors.
In our example, the total number of visits rises to 12,000 visits/year.
12,000 / 1,353 = 8.86
Conservative capacity: 10 sales reps.
Theoretical capacity: 9 sales reps
In percentage terms, you increase your sales force by approximately the number of ambassador points of sale you have.
Here is an example in GMS,
Network: 1,000 stores
Breakdown: 20% hypers (200), 60% supers (600), 20% convenience/drive (200).
Hypermarkets: 200
Supermarkets: 600
Convenience stores: 200
Target frequencies: hyper 24/year, super 18/year, convenience 12/year.
Calculation of visits/year:
Hypers: 200 × 24 = 4,800
Supers: 600 × 18 = 10,800
Convenience/drive: 200 × 12 = 2,400
Total = 18,000 visits/year
As a reminder, your sales reps have a visiting capacity of 1,000 visits / year.
18,000 / 1,000 = 18 sales reps
You can apply the same calculation with an increased frequency on the stores that bring you the most profit.
Same network of 1,000, including 15% ambassadors (= 150 stores).
Breakdown of ambassadors: 30% hypers (45), 60% supers (90), 10% convenience (15).
Increased "ambassador" frequency: hyper 36/year, super 30/year, convenience 24/year.
Non-ambassadors remain at standard frequencies (24 / 18 / 12).
Step-by-step calculation:
Non-ambassadors
Hypers: (200 − 45) × 24 = 155 × 24 = 3,720
Supers: (600 − 90) × 18 = 510 × 18 = 9,180
Convenience: (200 − 15) × 12 = 185 × 12 = 2,220
Total non-ambassadors = 15,120
Ambassadors
Hypers: 45 × 36 = 1,620
Supers: 90 × 30 = 2,700
Convenience: 15 × 24 = 360
Total ambassadors = 4,680
Total visits/year = 15,120 + 4,680 = 19,800
Sizing: 19,800 / 1,000 = 19.8, i.e., 20 sales reps
Increasing visit frequency across 15% of stores leads to a requirement of +2 sales reps, about a +10% increase in workload.
Marginal analysis
There is also a marginal analysis technique, explained by Fardjellah Benaissa, in his LinkedIn article. The marginal analysis method consists of recruiting sales reps up to the point where the last sales rep recruited costs more than they generate.
The ideal size is the one before the last recruitment. Here, you must take into account the cost of the sales force.
In our example, a sales rep will cost your company (fixed + variable + vehicle + tools + taxes/benefits) €85,000 / year. We will represent this as: CM_rep (marginal cost of a rep).
The expected marginal gain of each sales rep depends on market saturation, cannibalization, and loss of density within sales territories. In our calculation, the expected marginal gain GM_n decreases as n increases.
This refers to additional gross margin (not revenue), in order to compare "dollars of margin" with "dollars of cost."
For each added sales rep, we compare: GM_n vs CM_rep = €85k.
n (cumulative) | Marginal gain GMₙ | Marginal cost CM | Marginal net margin (GMₙ−CM) | Cumulative net margin |
|---|---|---|---|---|
1 | 220 | 85 | +135 | +135 |
2 | 190 | 85 | +105 | +240 |
3 | 165 | 85 | +80 | +320 |
4 | 145 | 85 | +60 | +380 |
5 | 130 | 85 | +45 | +425 |
6 | 118 | 85 | +33 | +458 |
7 | 108 | 85 | +23 | +481 |
8 | 100 | 85 | +15 | +496 |
9 | 93 | 85 | +8 | +504 |
10 | 87 | 85 | +2 | +506 |
11 | 82 | 85 | -3 | +503 |
12 | 78 | 85 | -7 | +496 |
Here is how to interpret this table:
The 11th sales rep destroys value (-€3k).
The optimal size is therefore 10 sales reps (the last line that is still positive).
Cumulative net margin peaks at +€506k with 10 sales reps on the team, and then declines.
The first example does not take management into account, which is nevertheless part of the daily routine. We will now add it.
Marginal analysis with management tier
Beyond 8 sales reps, you add 1 manager (cost of €100k / year).
n (cumulative) | Marginal gain GMₙ | Marginal cost CM | Marginal net margin (GMₙ−CM) | Cumulative net margin |
|---|---|---|---|---|
1 | 220 | 85 | +135 | +135 |
2 | 190 | 85 | +105 | +240 |
3 | 165 | 85 | +80 | +320 |
4 | 145 | 85 | +60 | +380 |
5 | 130 | 85 | +45 | +425 |
6 | 118 | 85 | +33 | +458 |
7 | 108 | 85 | +23 | +481 |
8 | 100 | 85 | +15 | +496 |
9 | 93 | 97.5 | -4.5 | +491.5 |
10 | 87 | 97.5 | -10.5 | +481 |
The marginal cost of the 9th sales rep becomes: 85 + (100 / 8) ≈ €97.5k if you allocate the extra cost over the next 8 reps, or if you handle the extra cost all at once when moving from 8→9.
With a management tier, the optimal size becomes 8 sales reps.
There are several other calculation techniques. We have decided to keep only these three, which seem to us the most suitable for calculating field sales force size.
We hope this article is helpful to you!
It was by observing the still-fledgling digitalization of sales forces that Arthur envisioned Sidely. A graduate of EM Lyon and Le Wagon, he combines a rare commercial rigor with a true product culture. This dual expertise allows him to decipher the shifts in the profession and build a product that truly speaks to sales teams.
See also

Artificial intelligence and field professions: what our 2026 studies reveal
Adoption, barriers, use cases: discover what our three studies reveal about the role of AI among sector managers, sales representatives, and foodservice sales reps.

CHR and RHF Sales Representatives: portrait of a relationship-driven profession in the era of data
Equipment, productivity, AI: discover the major trends for the HORECA and food service sales profession in 2026 through our field study.

Pharmaceutical Sales Representative in France: Portrait of a Field Job Under Pressure
Compensation, aspirations, AI usage: discover the major trends in the pharmaceutical sales representative profession in 2026 through our field study.

Area Sales Managers in France: who are they and how is the profession evolving in 2026?
Compensation, aspirations, AI usage: discover the major trends in the field sales representative profession in 2026 through our field study.
The area manager professions in 2026
Discover the trends, the challenges, and the key figures.