

Penetration rate: the strategic indicator for brands in distribution networks
Definition, calculation formula, and interpretation. Learn more about the penetration rate, a strategic indicator to manage your brands' performance.

In short
6 min read
The penetration rate measures the proportion of households or customers who purchased a product at least once over a given period.
It is a fundamental indicator for assessing the actual adoption of a brand or category within its target market.
The calculation formula is: (Number of buyers / Target population) × 100.
It is a driver of strategic growth when combined with distribution, sell-out, and field execution data.
A good understanding of this indicator allows for precise management of distribution and commercial efficiency within the retail network.
Specialized tools like Sidely enable manufacturers to analyze this data to gain commercial agility.
In physical distribution channels such as supermarkets, specialized superstores, food service/Horeca, or parapharmacies, brands must precisely manage their distribution and adoption. Among the key indicators to monitor, the penetration rate allows estimating a product's or brand's ability to reach its target audience.
This article offers a comprehensive overview of this essential indicator for any retail development strategy.
1) What is the penetration rate?
The penetration rate measures the proportion of customers or households that have purchased a product, brand, or category at least once over a given period. It provides a clear view of product adoption within its target market.
Calculation formula:
→ Penetration rate (%) = (Number of buyers / Target population) × 100
Example: A dietary supplement brand was purchased by 250,000 households out of a target population of 5 million. The penetration rate is therefore 5%.
The penetration rate must reflect a readable reality, without ambiguity or risk of misinterpretation. To achieve this, it is essential to set clear temporal and geographical criteria, which will allow for a consistent reading of the indicator. This rigor is especially crucial since the penetration rate is a KPI meant to be tracked over time: the calculation methods must remain stable from one period to another to ensure the reliability of comparisons.
Since the adoption of a product or service is influenced by multiple factors—product life cycle, advertising efforts, competitive pressure, market saturation—only regular and well-structured measurement allows for relevant tracking of its evolution.
The penetration rate is often referred to as the market coverage rate. It is also called the market occupation ratio.
Because the same consumer can purchase products from multiple brands, it is common for the sum of the penetration rates of all players in the same market to exceed 100%.
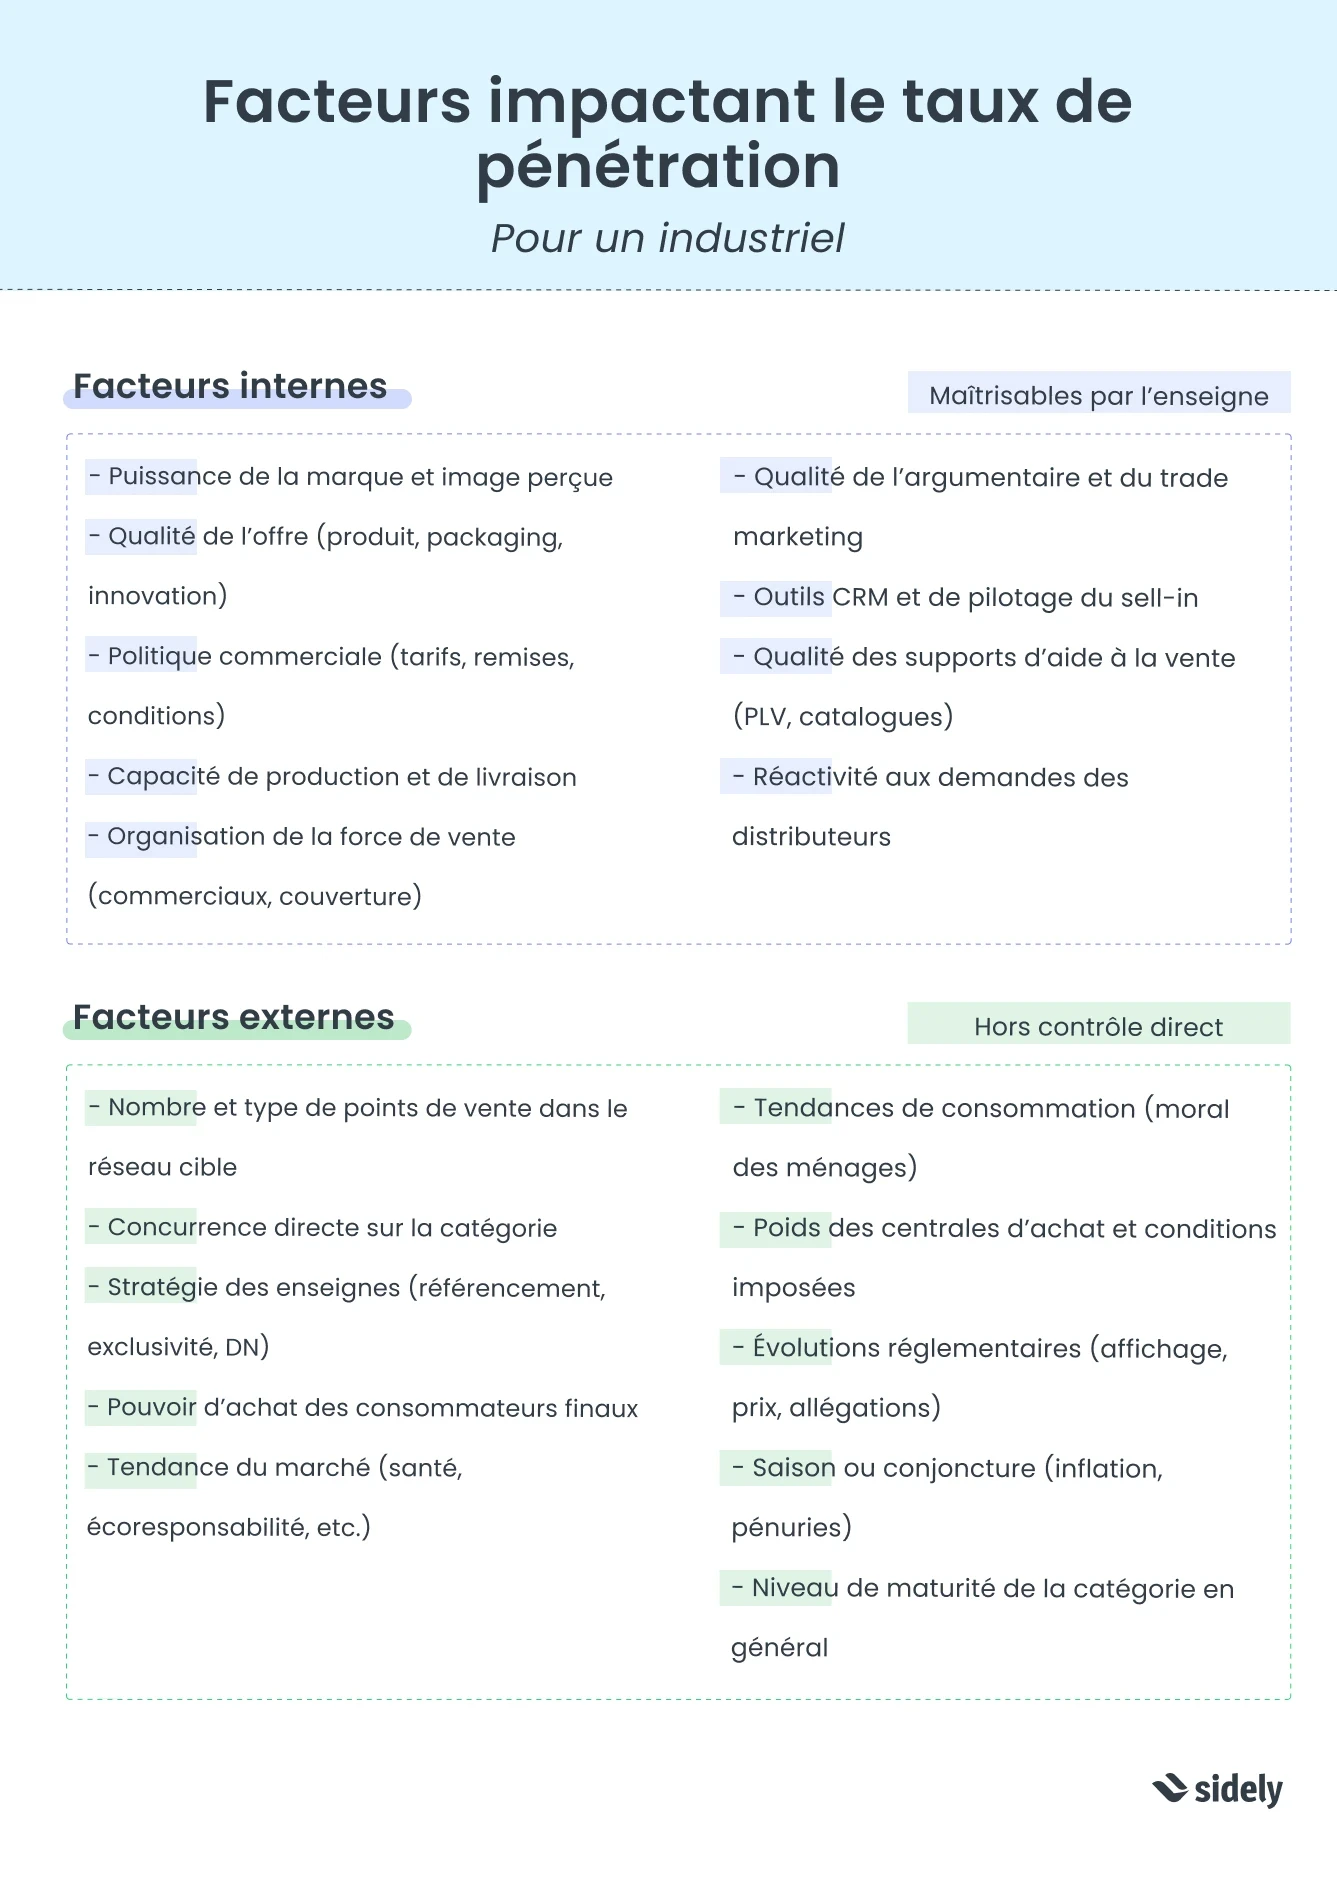
Factors impacting the penetration rate (for a manufacturer)
The penetration rate is the result of strategic actions implemented by the company, but also of external factors (its economic environment).
Internal factors | External factors |
|---|---|
|
|
2) Why monitor your penetration rate?
The penetration rate measures a strategic reality: the actual adoption or effective visibility of a product.
For a brand, this makes it possible to:
Measure its ability to recruit new buyers;
Identify a market's saturation phase;
Track the effect of a launch or promotional campaign;
Identify areas of geographical or categorical underperformance;
Evaluate a listing strategy or prescription strategy in pharmacies, specialized superstores, or Horeca;
Manage a progressive penetration policy (product tested locally then rolled out widely).
The penetration rate is therefore a "scientific" tool that helps guide strategic decision-making for manufacturers, particularly regarding product lifecycles, innovation, and offering development (ranges, assortment, etc.).
Retailers can also use it to calculate the share of customers with a loyalty card or enrolled in a specific program.
This tool will also be the key measurement indicator for a penetration strategy (or policy), which aims to capture market share by offering low prices.
Finally, the penetration rate is fundamental in market analysis and can be accompanied by a PESTEL analysis to assess macro-environmental factors (Political, Economic, Sociocultural, Technological, Environmental, and Legal) that may influence a company's success in a given territory.
💡For a 360° view, the penetration rate can be cross-referenced with other key retail indicators: numeric distribution, weighted distribution, sales index, out-of-stock rate, etc.
Trial purchase versus adoption
A word of caution regarding the use of the term adoption, which may suggest that the consumer is loyal to the brand or product, when they are not systematically retained after their first purchase.
This is why, while the penetration rate is the ideal indicator to accompany an activation campaign targeting first-time buyers, or to measure the evolution of the number of converted consumers (at least one purchase) over the long term, customer loyalty must be measured with other tools (loyalty cards, CRM, retailer panels, etc.).
3) Specific use cases
Manufacturers and retailers can have a different understanding of this indicator:
Product: the product penetration rate (or consumer or panel penetration rate) generally refers to the adoption rate of a product by its target population over a given period. This is the central topic of this article.
Point of sale: the penetration rate of a store corresponds to the percentage of actual customers within its trade area. This indicator is fundamental for large retailers whose territorial network aims to cover the territory optimally by dividing it into commercial potential.
Cumulative penetration: the proportion of customers (who have already purchased) willing to try a new product over a given period. It measures the product's ability to attract the brand's existing customers.
Marketing campaign: in the advertising field, we measure the effective audience (among the individuals reached by the campaign, how many match the intended target?). The result is correlated with the initial potential. This is the advertising penetration rate.
While companies operating in large-scale retail are accustomed to using retail panels like Kantar or NielsenIQ, companies using other channels will sometimes need to cross-reference their CRM data (e.g., number of points of sale stocking a brand product) with data from external databases or professional directories. Various free or paid services offer directories or qualified databases by industry (pharmacy, IT, hotel-restaurant-cafe, etc.).
4) Avoiding confusion
Depending on the industry and corporate culture, the term penetration rate can also be used to refer to peripheral concepts. Therefore, one must be careful to avoid confusion.
Market share
Unlike market share, the penetration rate focuses on the number of targets reached and not the volume consumed. Thus, a customer who purchased 4 times is counted neither in purchase volume nor in generated value, but only as a targeted unit (1 individual reached).
Network penetration rate
Furthermore, some companies have developed a habit of using the term penetration rate instead of numeric distribution, to refer to the actual coverage in points of sale or the growth rate within a target network. For example, a brand present in 200 restaurants out of a target potential of 500 might speak of a 40% network penetration. In fact, the exact term (numeric distribution) is more common in large-scale retail.
Field coverage rate
Finally, while coverage rate is indeed synonymous with penetration rate, the field coverage rate measures the percentage of points of sale visited by field sales representatives over a given period.
5) How to analyze your penetration rate
Analyzing the penetration rate cannot be done in isolation: it must always be interpreted in light of other indicators, the market context, and the brand's strategic objectives.
A primary analysis criterion concerns the absolute level of the penetration rate. A rate of 5% may seem low, but it can be excellent in a highly targeted niche market (e.g., premium products), whereas it would be insufficient for fast-moving consumer goods (FMCG) (e.g., bottled water, diapers, infant milk).
One must also observe the evolution dynamic of the rate over time:
A stable but high rate may indicate a well-established buyer base;
A rapidly increasing rate signals a strong customer acquisition dynamic;
A high rate accompanied by a low repeat purchase rate may reveal issues with loyalty or product experience.
Another angle of analysis consists of cross-referencing the penetration rate with other indicators:
Market share: a high penetration rate combined with a low market share can indicate a trial purchase without conversion;
Repeat purchase index: useful for measuring the depth of customer engagement;
Numeric distribution (ND): a low penetration rate despite a high ND can point to a shelf visibility issue, price positioning, or pitching issues.
Finally, it is relevant to perform a geographical or retailer-specific analysis of the penetration rate to detect underperforming areas or strengths to replicate.
⚠️ Market saturation
In certain setups, reaching a very high penetration rate is not without risk. When a core target has been widely covered, and with a high repeat purchase rate, a saturation phenomenon may loom on the horizon.
Manufacturers must innovate, create new segments, or offer complementary products to find new growth opportunities. Without development, the product lifecycle and the aggressiveness of competitors can lead to flatlining revenue.
6) How to improve your penetration rate
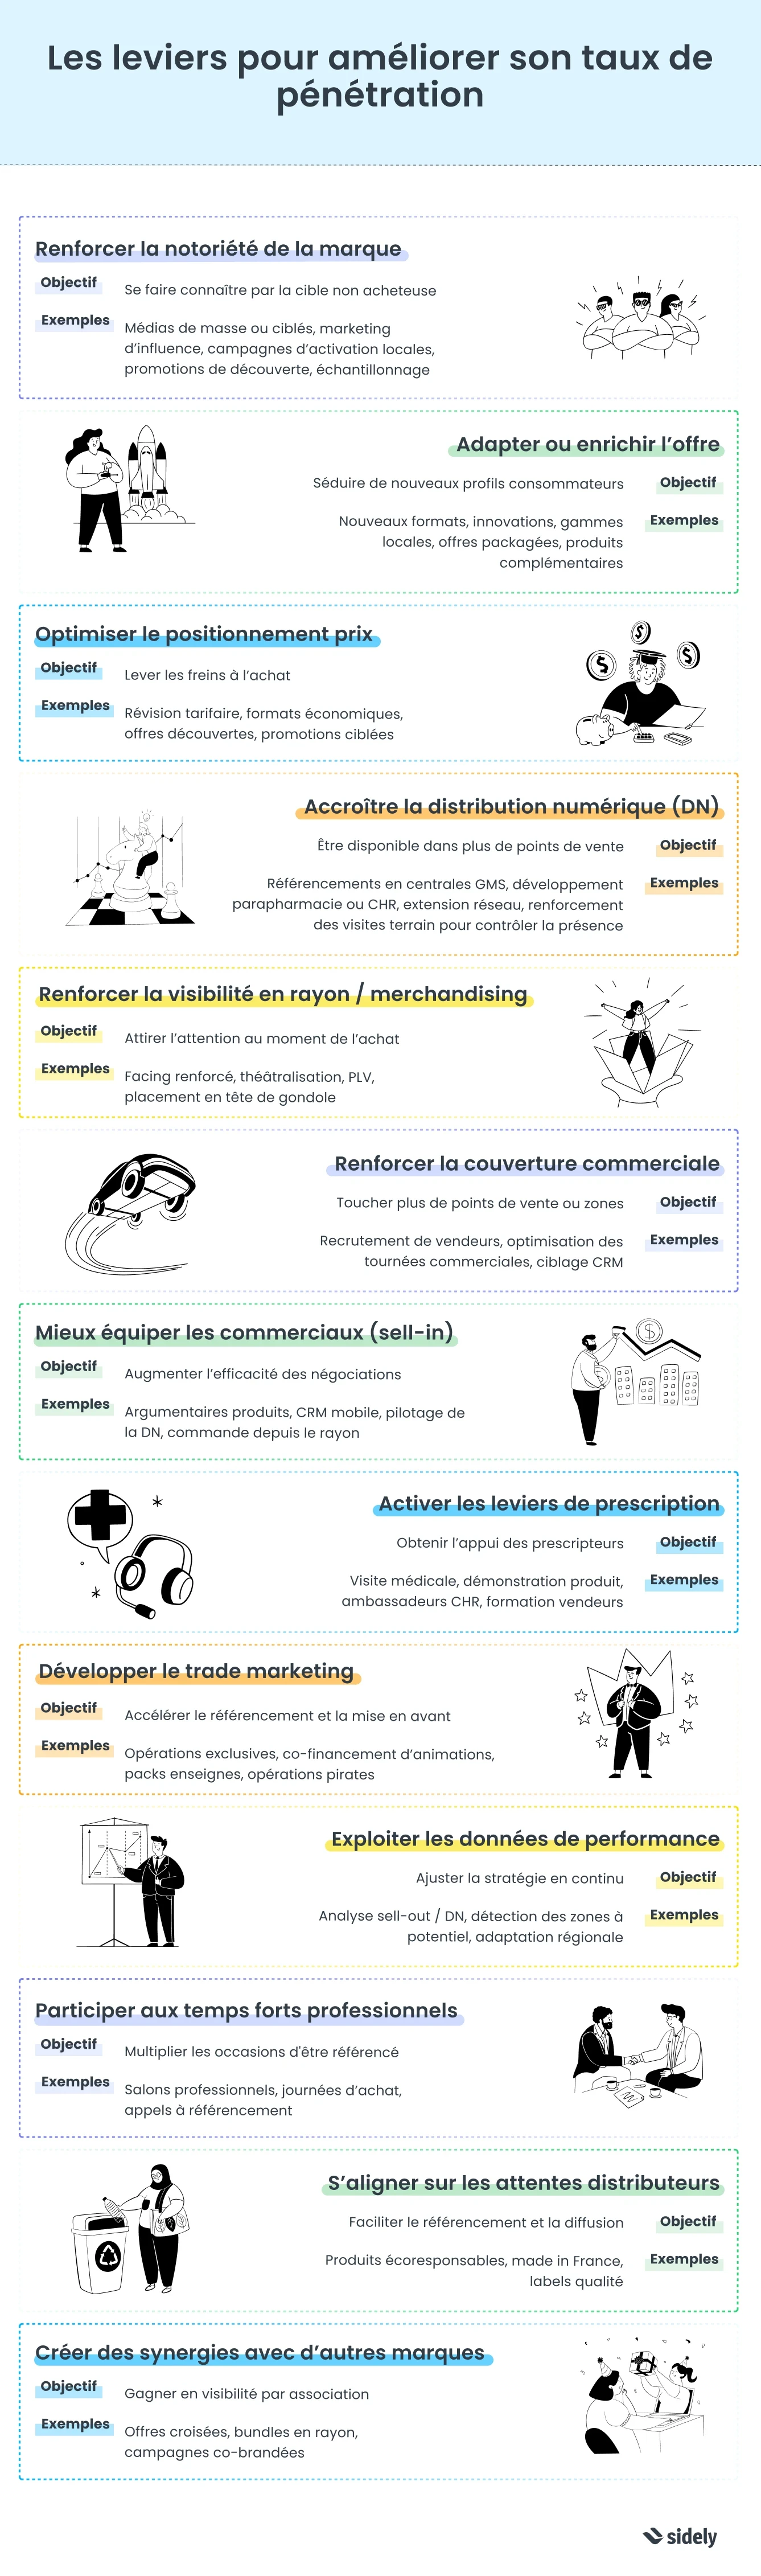
Improving your penetration rate means above all increasing the number of unique buyers. This involves convincing new customers but also making the product accessible in more purchasing contexts. The levers to activate vary depending on the distribution channel, brand maturity, and target typology.
Here are the main methods used by manufacturers to increase their penetration.
Lever | Objective | Action examples |
|---|---|---|
Strengthen brand awareness | Get known by the non-buying target audience | Mass or targeted media, influencer marketing, local activation campaigns, trial promotions, sampling |
Adapt or enrich the offer | Attract new consumer profiles | New formats, innovations, local ranges, package offers, complementary products |
Optimize price positioning | Remove barriers to purchase | Price review, economy formats, trial offers, targeted promotions |
Increase numeric distribution (ND) | Be available in more points of sale | Listings in supermarket central buyers, parapharmacy or Horeca development, network expansion, strengthening field visits to monitor presence |
Strengthen shelf visibility / merchandising | Attract attention at the time of purchase | Increased facings, point-of-sale displays, promotional ends of aisles |
Strengthen sales coverage | Reach more points of sale or regions | Recruiting sales reps, optimizing commercial routes, CRM targeting |
Equip sales reps better (sell-in) | Increase the effectiveness of negotiations | Product pitches, mobile CRM, ND management, ordering directly from the aisle |
Activate prescription levers | Get support from recommenders/influencers | Medical representative visits, product demonstrations, Horeca ambassadors, sales training |
Develop trade marketing | Accelerate listings and highlights | Exclusive operations, co-financing of events, retailer packs, guerrilla marketing |
Leverage performance data | Continuously adjust the strategy | Sell-out / ND analysis, detecting high-potential areas, regional adaptation |
Participate in trade events | Multiply opportunities to get listed | Trade shows, buying days, calls for tender |
Align with retailer expectations | Facilitate listing and distribution | Eco-friendly products, locally made products, quality labels |
Create synergies with other brands | Gain visibility through association | Cross-offers, in-store bundles, co-branded campaigns |
7) Use your CRM to boost your in-store penetration
At Sidely, we know that the penetration rate is not achieved by decree: it is built on the ground, store by store.
Our CRM allows you to:
Target non-stocking stores to integrate them into route plans;
Track out-of-stocks and merchandising actions in real time;
Provide sales reps with a clear view of product placement priorities;
Measure product penetration (or weighted distribution) in each retailer or network;
Plan optimized sales routes;
Generate automated visit reports with photos and comments;
Calculate facings, share of shelf space, and other performance metrics;
Track action plans related to agreements negotiated at headquarters.
Thanks to precise monitoring of sales activity, Sidely enables manufacturers to turn penetration strategy into concrete, measurable actions.
In Summary
The penetration rate is a fundamental indicator for measuring a product's success in establishing itself in a market. Well understood and properly leveraged, it becomes a powerful growth driver, especially when cross-referenced with distribution, sell-out, and field execution data. With a tool like Sidely, manufacturers have a CRM truly designed to accelerate their commercial distribution and gain responsiveness in the field.
Margot has been working in Tech and SaaS for 8 years, with a multi-product experience that has given her a unique understanding of business challenges. On a daily basis, she analyzes, relentlessly tests, and relies on facts to shed light on market trends and help sales teams move forward.
See also

Artificial intelligence and field professions: what our 2026 studies reveal
Adoption, barriers, use cases: discover what our three studies reveal about the role of AI among sector managers, sales representatives, and foodservice sales reps.

CHR and RHF Sales Representatives: portrait of a relationship-driven profession in the era of data
Equipment, productivity, AI: discover the major trends for the HORECA and food service sales profession in 2026 through our field study.

Pharmaceutical Sales Representative in France: Portrait of a Field Job Under Pressure
Compensation, aspirations, AI usage: discover the major trends in the pharmaceutical sales representative profession in 2026 through our field study.

Area Sales Managers in France: who are they and how is the profession evolving in 2026?
Compensation, aspirations, AI usage: discover the major trends in the field sales representative profession in 2026 through our field study.
The area manager professions in 2026
Discover the trends, the challenges, and the key figures.